Research
Housing Market Quarterly: Market cools down due to increased supply – prices rise slightly


The Dutch housing market appears remarkably robust. Despite geopolitical uncertainty, higher interest rates and economic uncertainty, home sales remain high and house prices continue to rise.

Summary
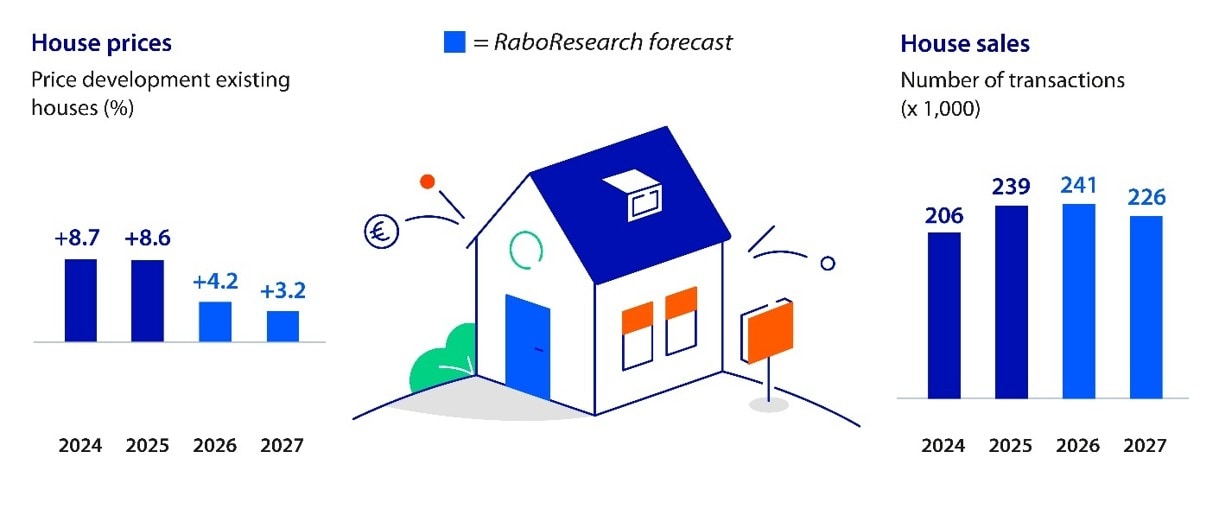
Figure 1: Many transactions and slightly rising house prices in 2026 and 2027
Looking back: house price development
Market cools down, but the impact of the conflict in the Middle East seems limited
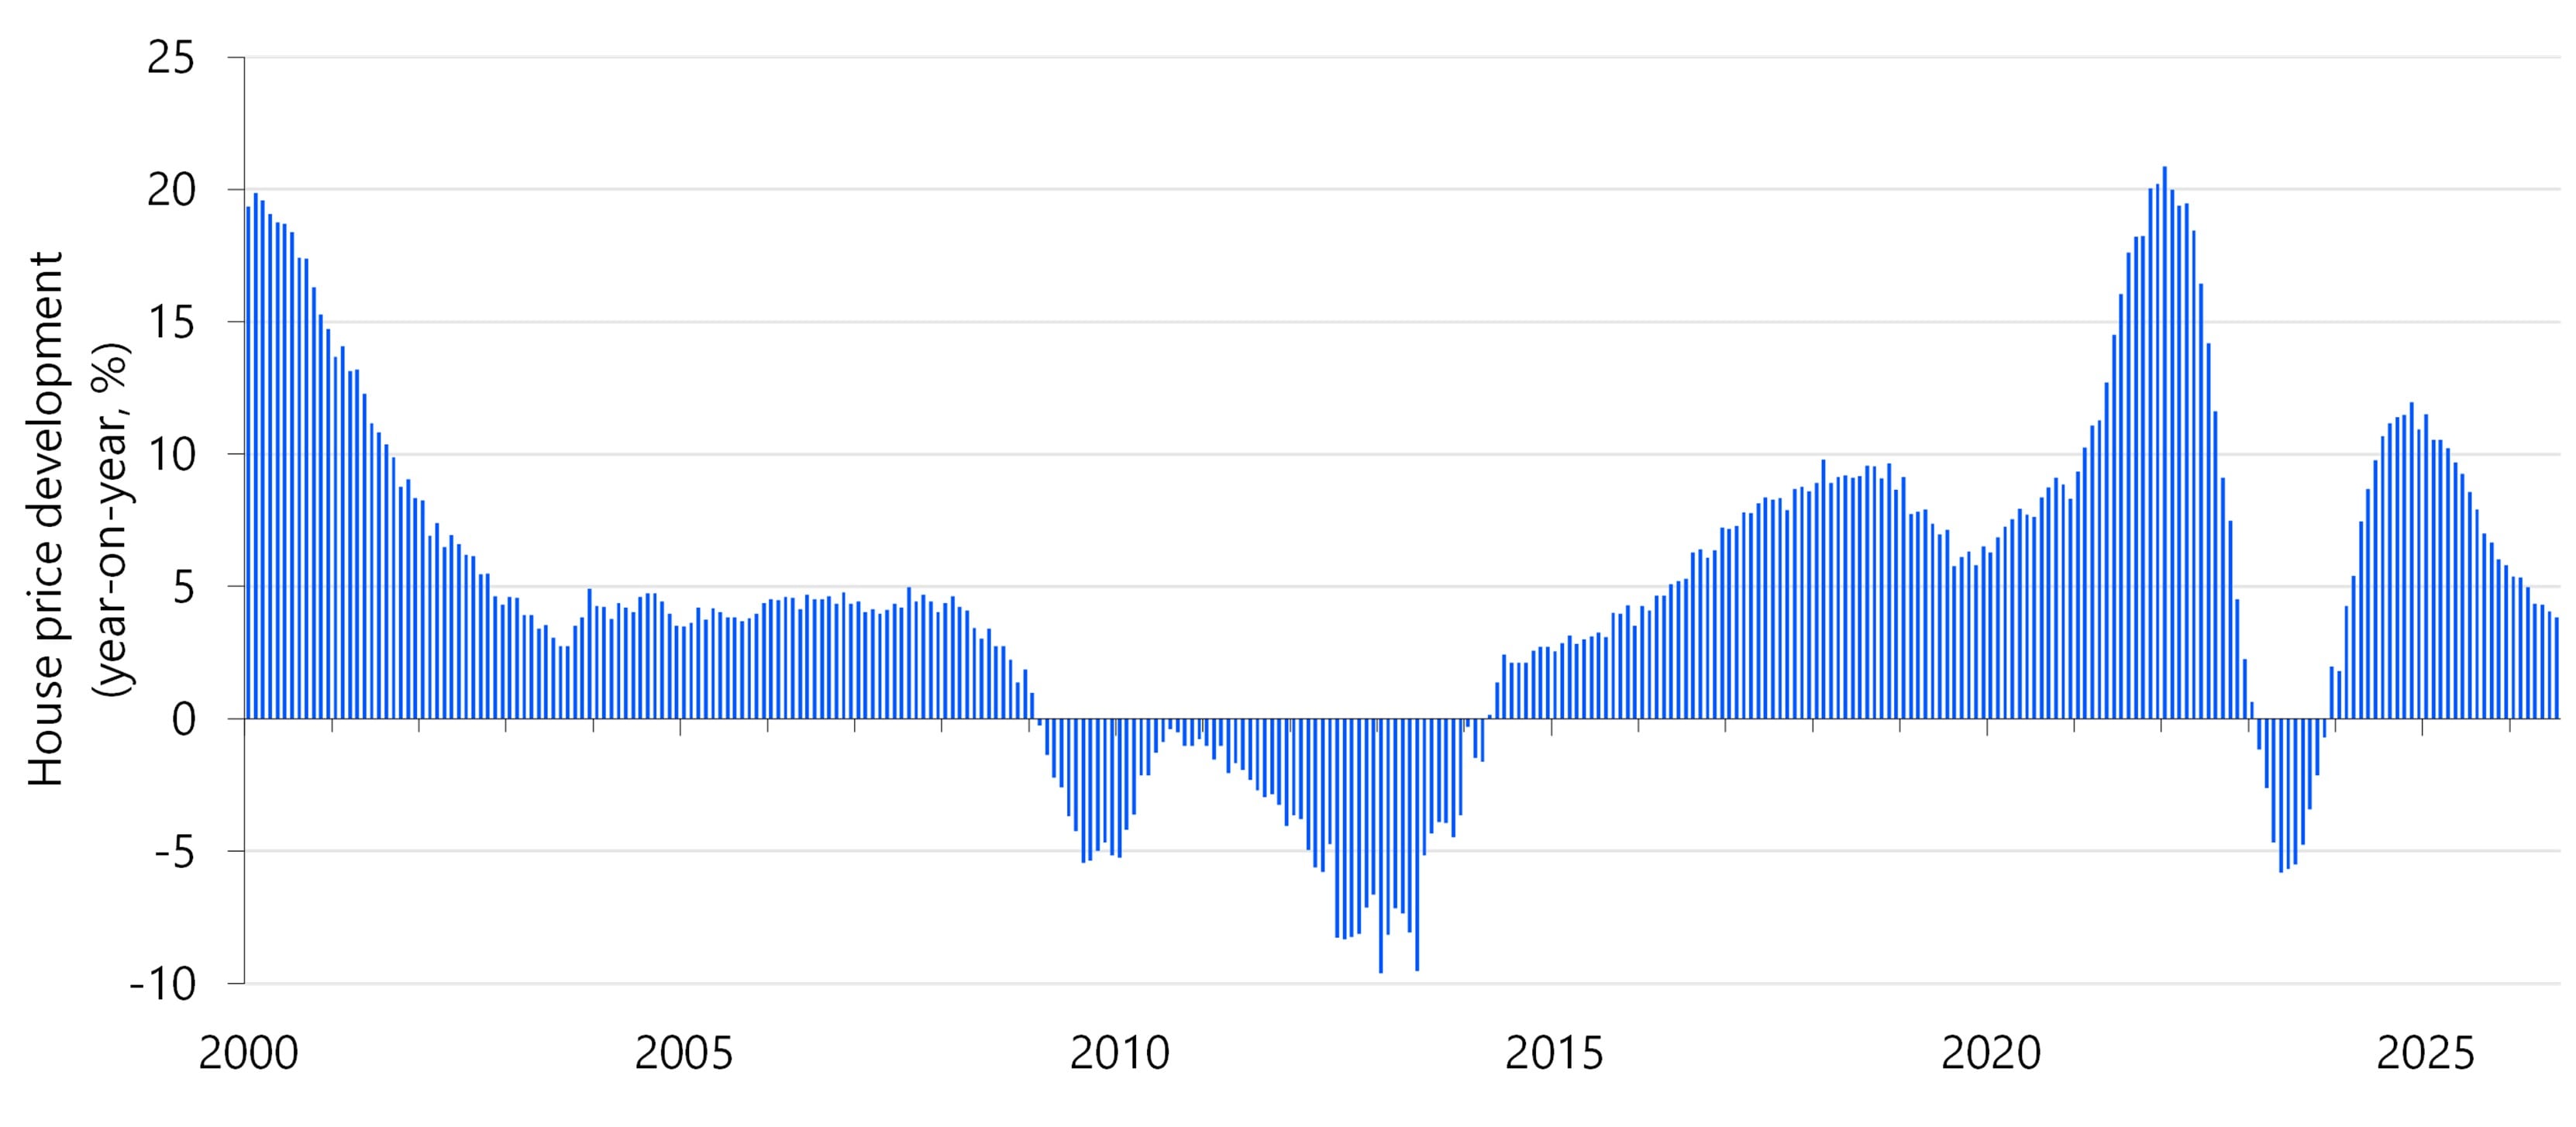
The increased geopolitical uncertainty has not yet resulted in a turnaround in the housing market. Meanwhile, the housing market statistics – which measure developments with some delay – give a first impression of the impact of the conflict in the Middle East. Although the rate at which house prices are rising is slowing down, no trend break is visible in the price index of existing owner-occupied homes of Statistics Netherlands and the Dutch Land Registry (Figure 2). The price growth of existing owner-occupied homes has been gradually declining since the spring of 2025. In recent months, this decline was not faster than at the beginning of this year. Seasonally-adjusted house prices continue to rise by about 0.3% per month. House prices were 3.9% higher in July – the last month for which CBS figures are available – than in the same month a year earlier. Although we cannot distinguish the consequences of the conflict from the contribution of other factors, the impact seems limited.
The number of transactions also remains high: in the twelve months up to and including July, more than 245,000 owner-occupied homes changed hands. Figures from the NVM real estate association also point mainly to a continuation of the trends that characterized the housing market in 2025: many transactions and a more moderate price development. The high number of homes put up for sale, including many ex-rental homes, is the main driving force. So, although the housing market is cooling down, there is no question of a market correction. There are several possible explanations for the so far mild effect on the housing market. For example, the interest rate increase is relatively small, especially compared to the period after the energy crisis. The economic impact also seems to be smaller than previously thought. The still large underlying housing scarcity probably also plays an important role.
Figure 2: House prices continue to rise, but at a slower pace
However, real house price growth has virtually come to a standstill
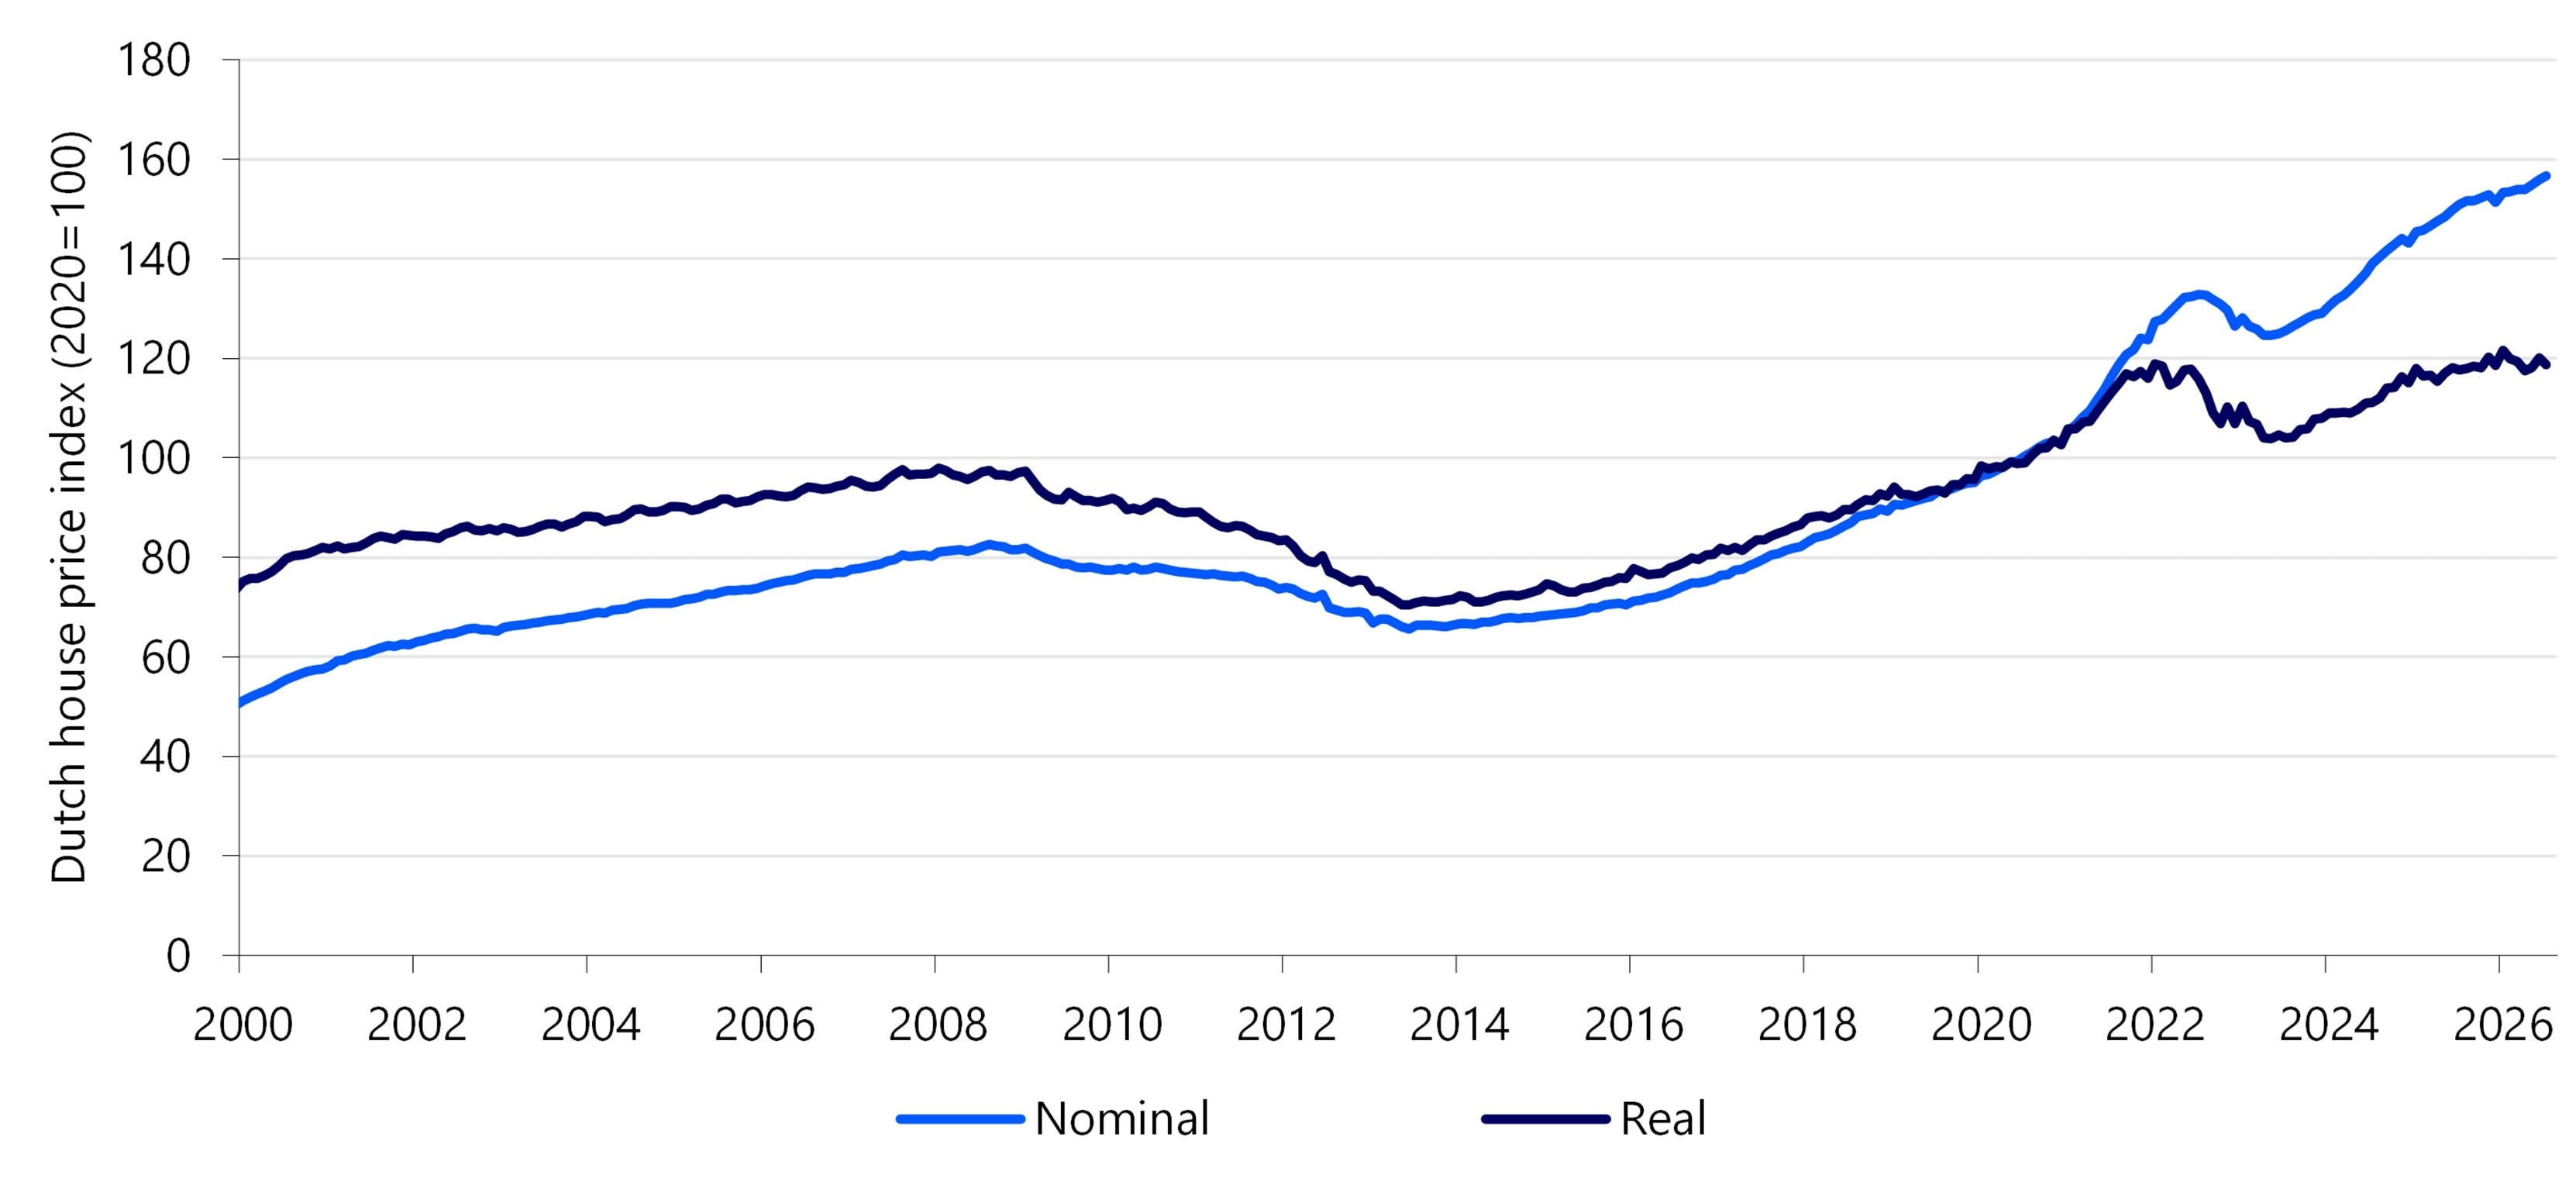
Although nominal house prices are still rising, real price growth – that is, price growth after adjusting for inflation – has virtually come to a standstill (Figure 3). Real house prices were only 0.9% higher in July than in July last year. House prices are therefore almost in line with wage developments. This means that the affordability of owner-occupied homes will now remain more or less constant for those who buy a house with their own funds, and are therefore not confronted with the increased mortgage rates.
Figure 3: Real house prices are barely rising anymore
Sentiment is deteriorating, but the market is still tight
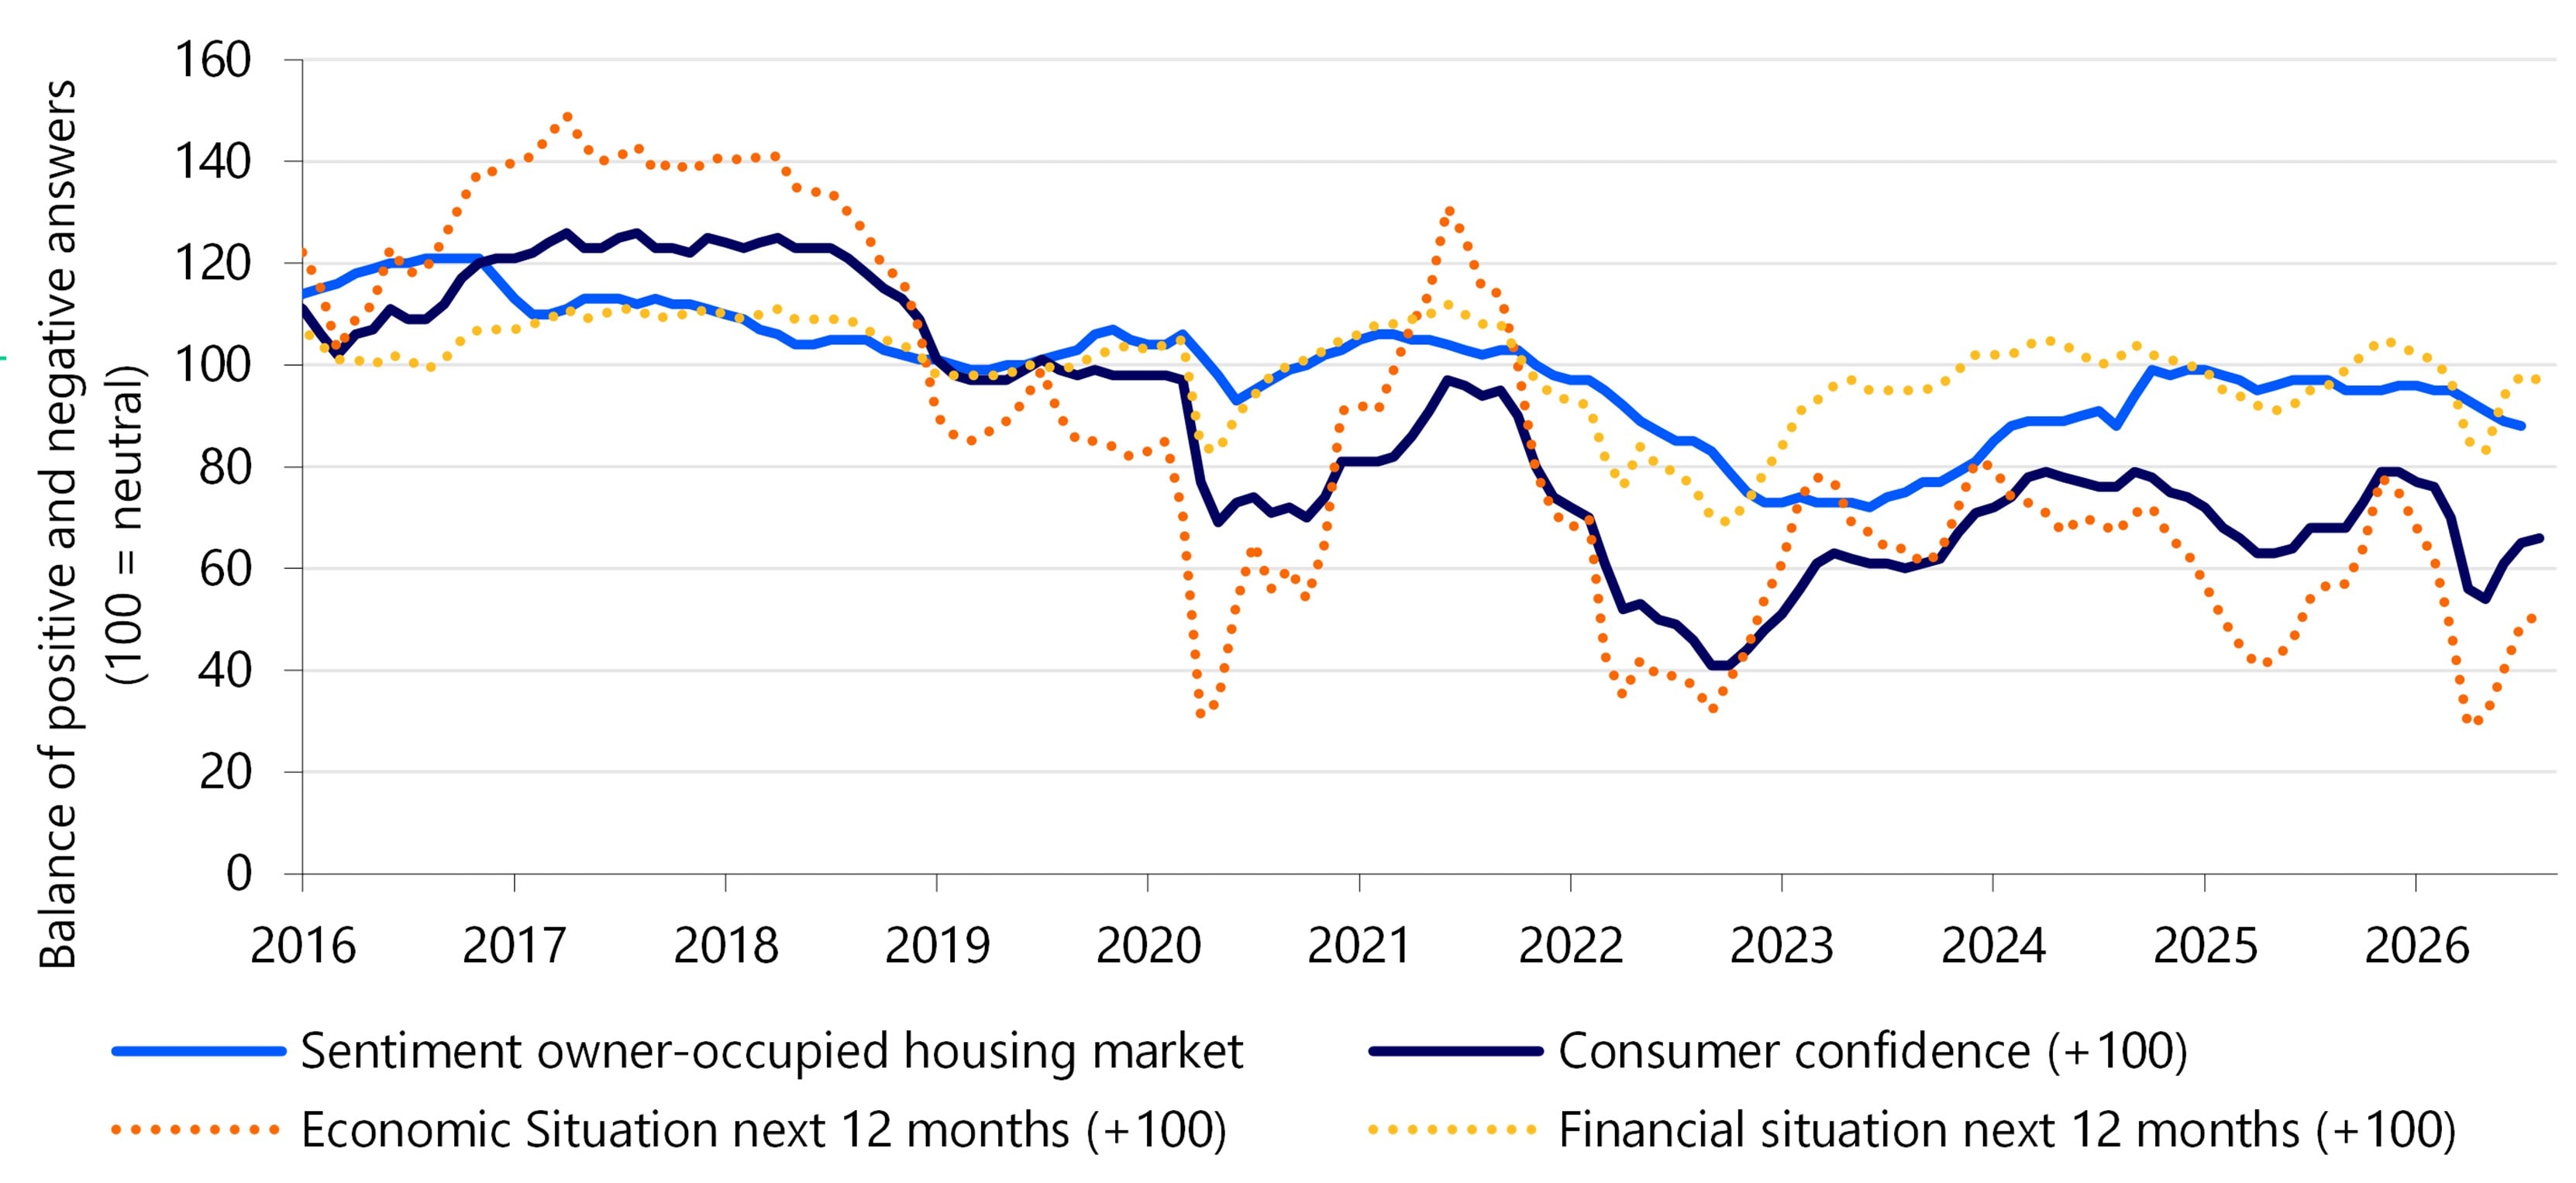
On the demand side, we see pluses and minuses. On the one hand, sentiment in the owner-occupied housing market has deteriorated further recently (Figure 4). Confidence in the owner-occupied housing market is therefore under some pressure. This is mainly due to the rise in mortgage interest rates (anticipated) by some consumers. The slower rising house prices also play a role. About half of residential consumers think it is currently an unfavorable time to buy a house. Respondents most often cite the lack of affordability of owner-occupied homes, a negative economic climate and the pressure on household income. In our thematic in-depth study 'Theme highlighted: affordability of owner-occupied homes remains a problem', we take a more detailed look at current developments in the affordability and financial accessibility of owner-occupied homes.
Although buyer sentiment is less positive, potential home buyers are not dropping out in large numbers. For example, the majority of homes put up for sale find a new buyer fairly quickly; the average selling time in the second quarter was only two days higher than a year ago. However, there are fewer interested parties per home. According to the Funda Index (in Dutch), there were eleven contact requests per home in the second quarter; a year ago there were fourteen. This is probably related to the extra supply. Although the market is somewhat more spacious than a year ago, according to the NVM real estate association, the market is still tight, with the majority of homes – 71% – also being sold above the asking price.
Figure 4: Sentiment in the owner-occupied housing market creeps further down
House price expectations
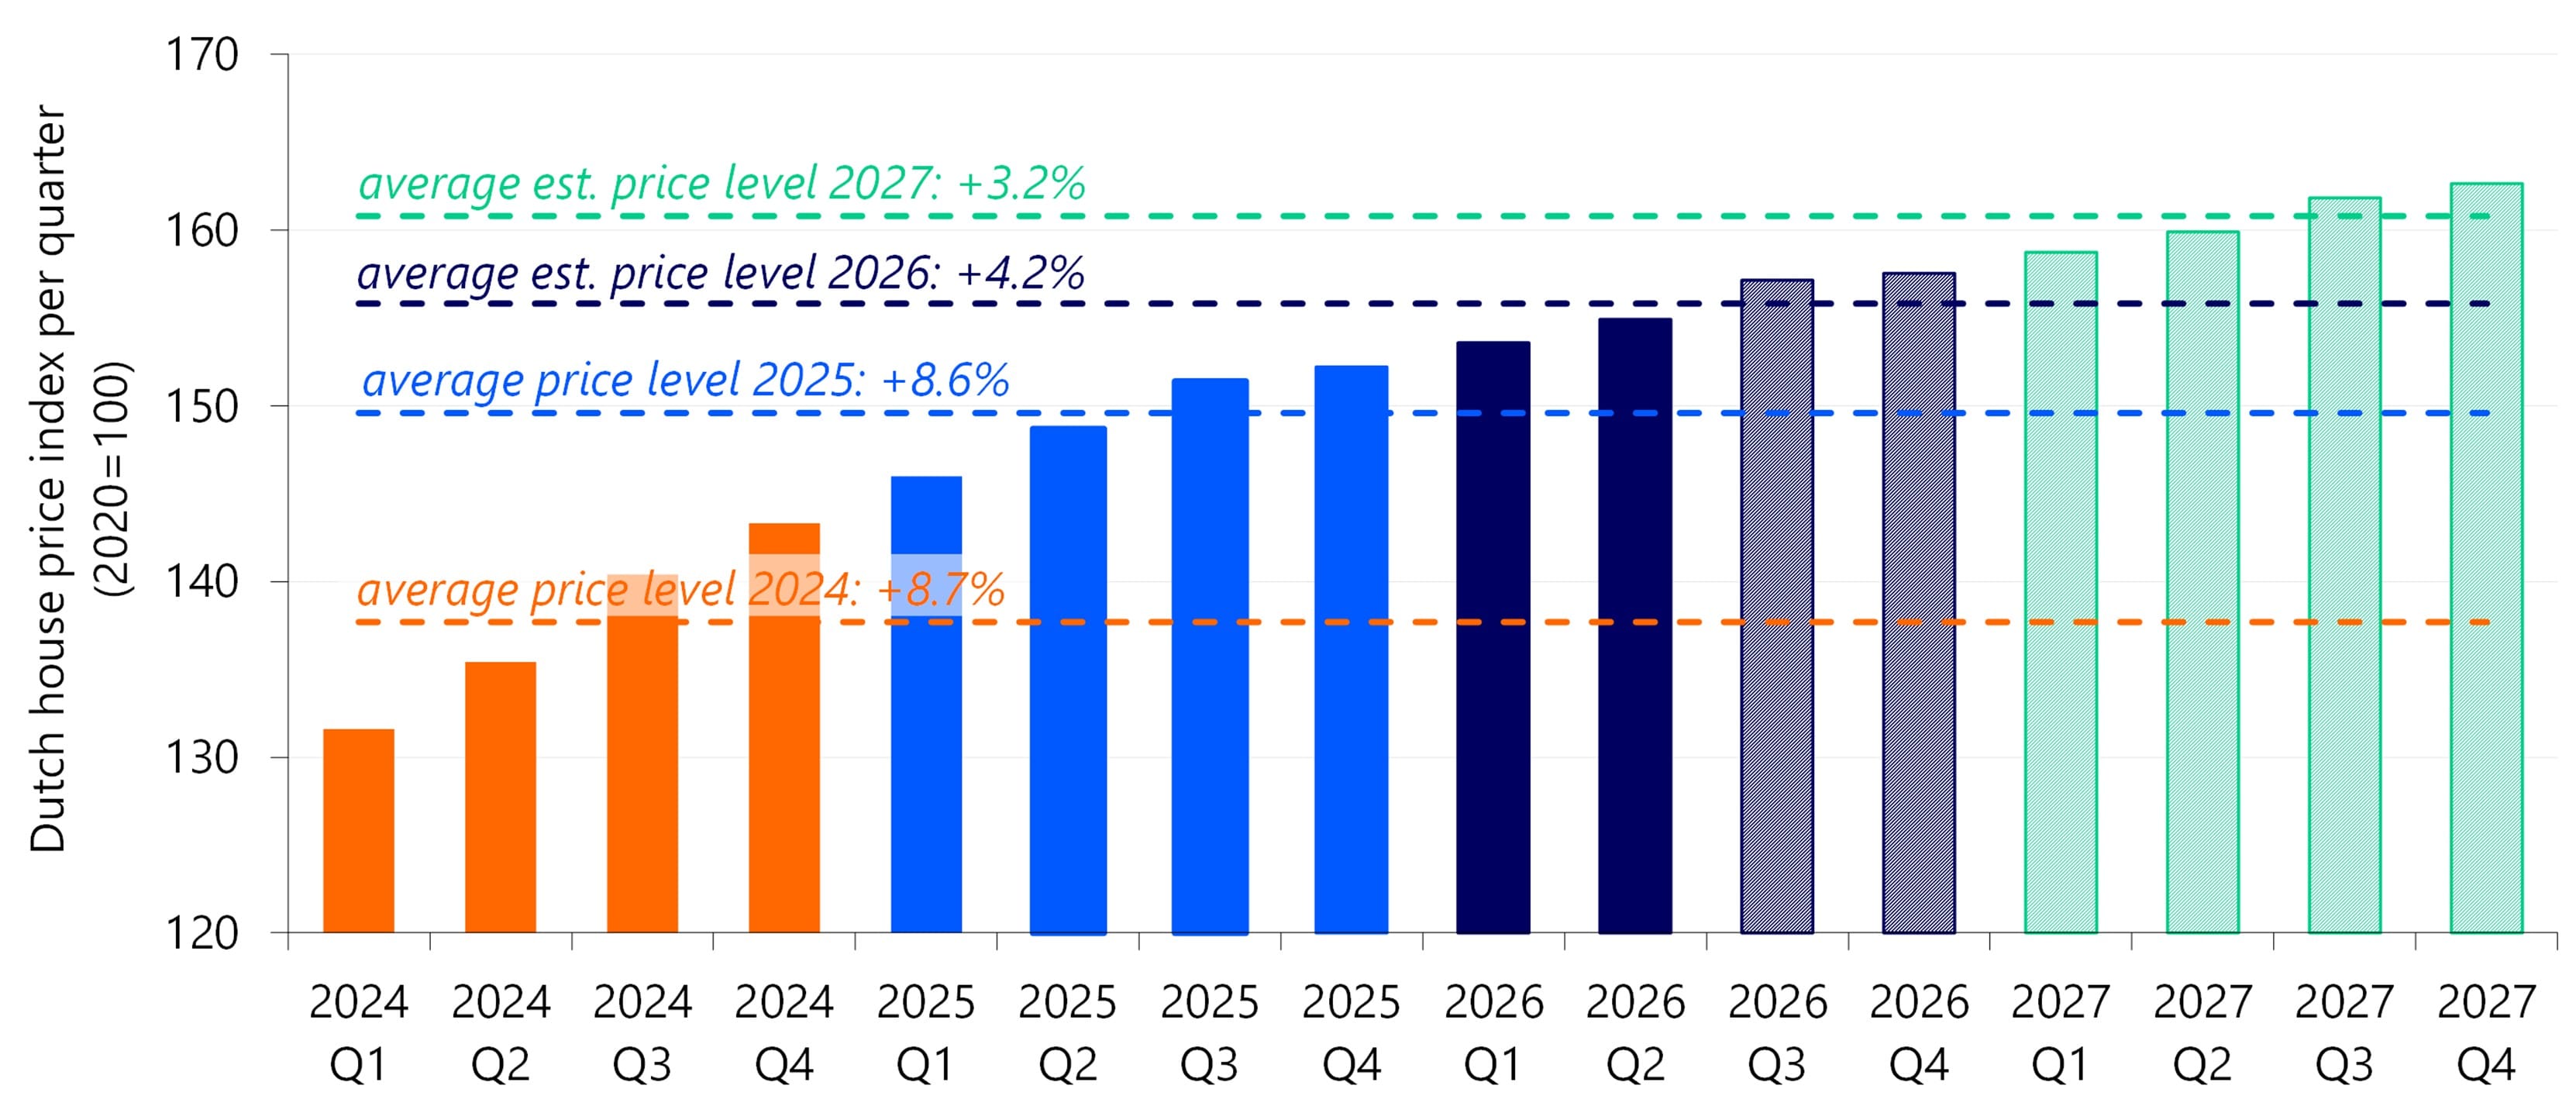
Existing owner-occupied homes are expected to become 4.2% more expensive on average this year, followed by a price increase of 3.2% next year (Figure 5). Compared to our previous Quarterly Report, we have revised our forecast upwards. In that report, we still assumed a price increase of 2.8% and 2.0% in 2026 and 2027, respectively. The adjustment is related to realisations: despite the high supply of owner-occupied homes and the conflict in the Middle East, we saw house prices rise further in the spring. This implies that the demand for owner-occupied homes rose faster than the supply. While in our previous estimate we still assumed slightly falling house prices in the second half of 2026, we now assume a very slight price increase for the rest of the year.
The conflict in the Middle East has led to higher capital market interest rates and leads to more economic uncertainty, but demographic trends, relatively strong wage growth and the still large underlying housing shortage continue to cause house prices to rise. On the supply side, we expect a gradual decline in the wave of sales of ex-rental homes by residential investors from the second half of this year. Together with our tempered expectations about residential construction, we expect the supply on the owner-occupied housing market to fall somewhat. As a result, price pressure will gradually increase again from next year.
Figure 5: House prices will continue to rise slightly this year and next
Macroeconomic picture
The economic impact of the situation around the Strait of Hormuz on the Dutch economy appears to be smaller than previously thought. In other words, the Dutch and European economies seem less susceptible to the consequences of rising energy prices than previously anticipated. We therefore expect higher economic growth and lower unemployment in our new macroeconomic outlook than we did three months ago. And that affects our house price estimate.
At the same time, our new baseline path assumes that the US-Iran stalemate will continue for the time being, keeping energy prices – and inflation in its wake – elevated for longer. In the long term, this also affects higher wage growth, which translates into more borrowing space and higher demand for owner-occupied homes. Collective bargaining wages are expected to increase by 4.2% in both 2026 and 2027.
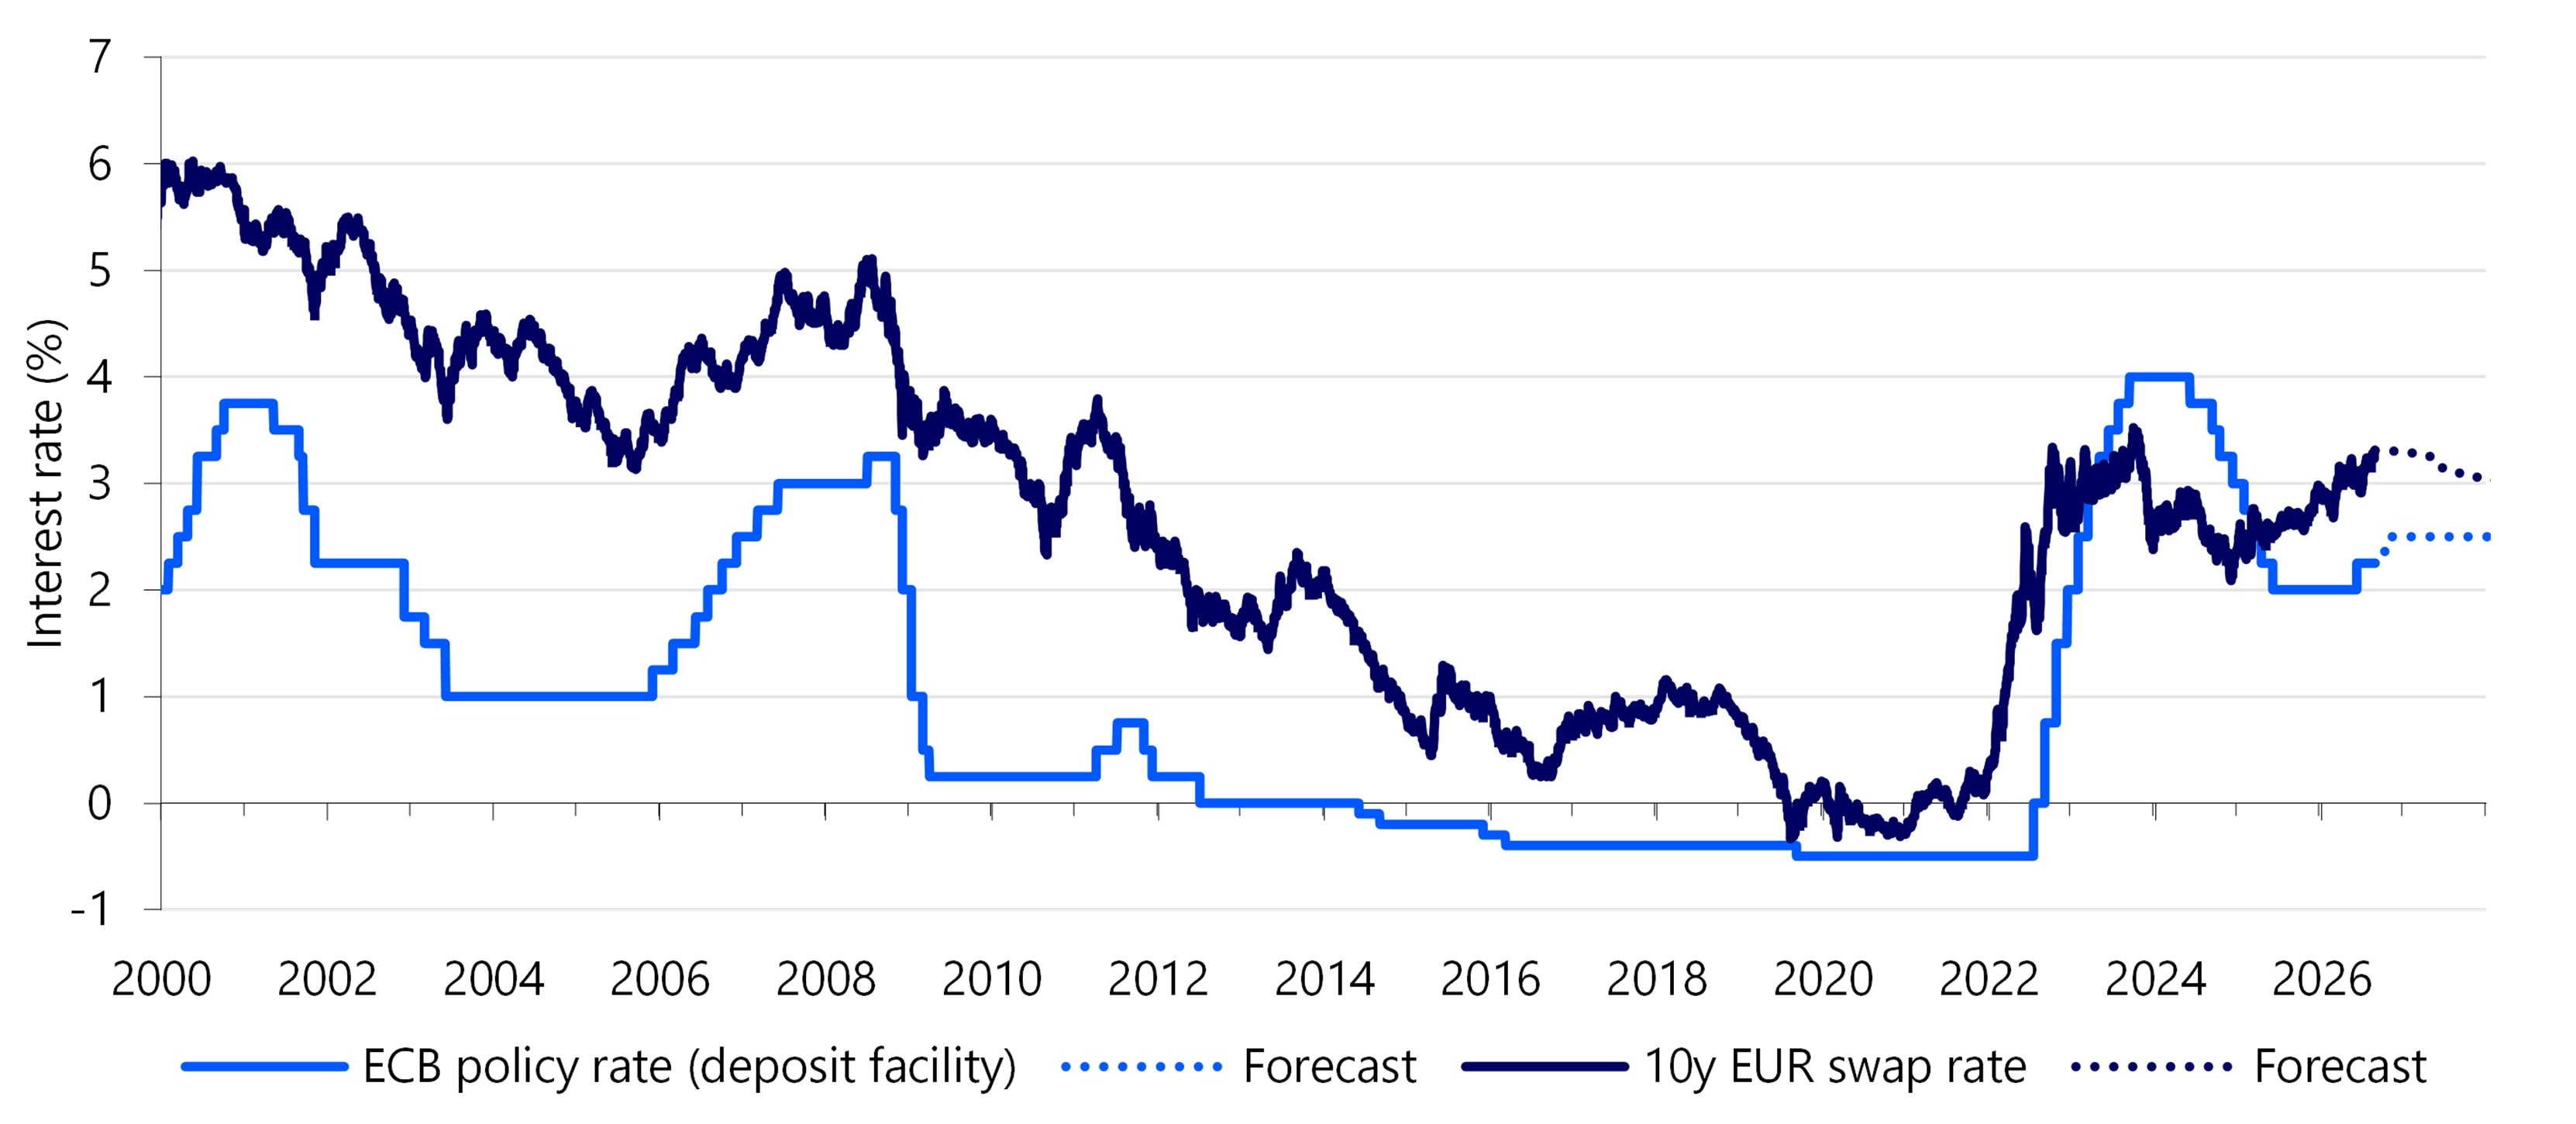
Rising inflation has also led to higher capital market interest rates (Figure 6). The average 10-year capital market rate – which determines mortgage rates – was 3.06% between March and the time of writing. While this is more than 20 basis points higher than the average of 2.84% from January and February, it is in stark contrast to the increase of around 300 basis points between the beginning and end of 2022. This probably partly explains why the impact of the increased interest rates on the housing market is now much smaller than it was then. In the past month, capital market interest rates rose further, to 3.3%. This is depressing demand for owner-occupied homes, but the increase remains only a fraction of the negative interest rate impulse that the housing market had to deal with in 2022. Capital market interest rates are expected to fall again in the coming years.
Figure 6: Capital market interest rates have peaked
Wave of sales of ex-rental homes gradually dies out
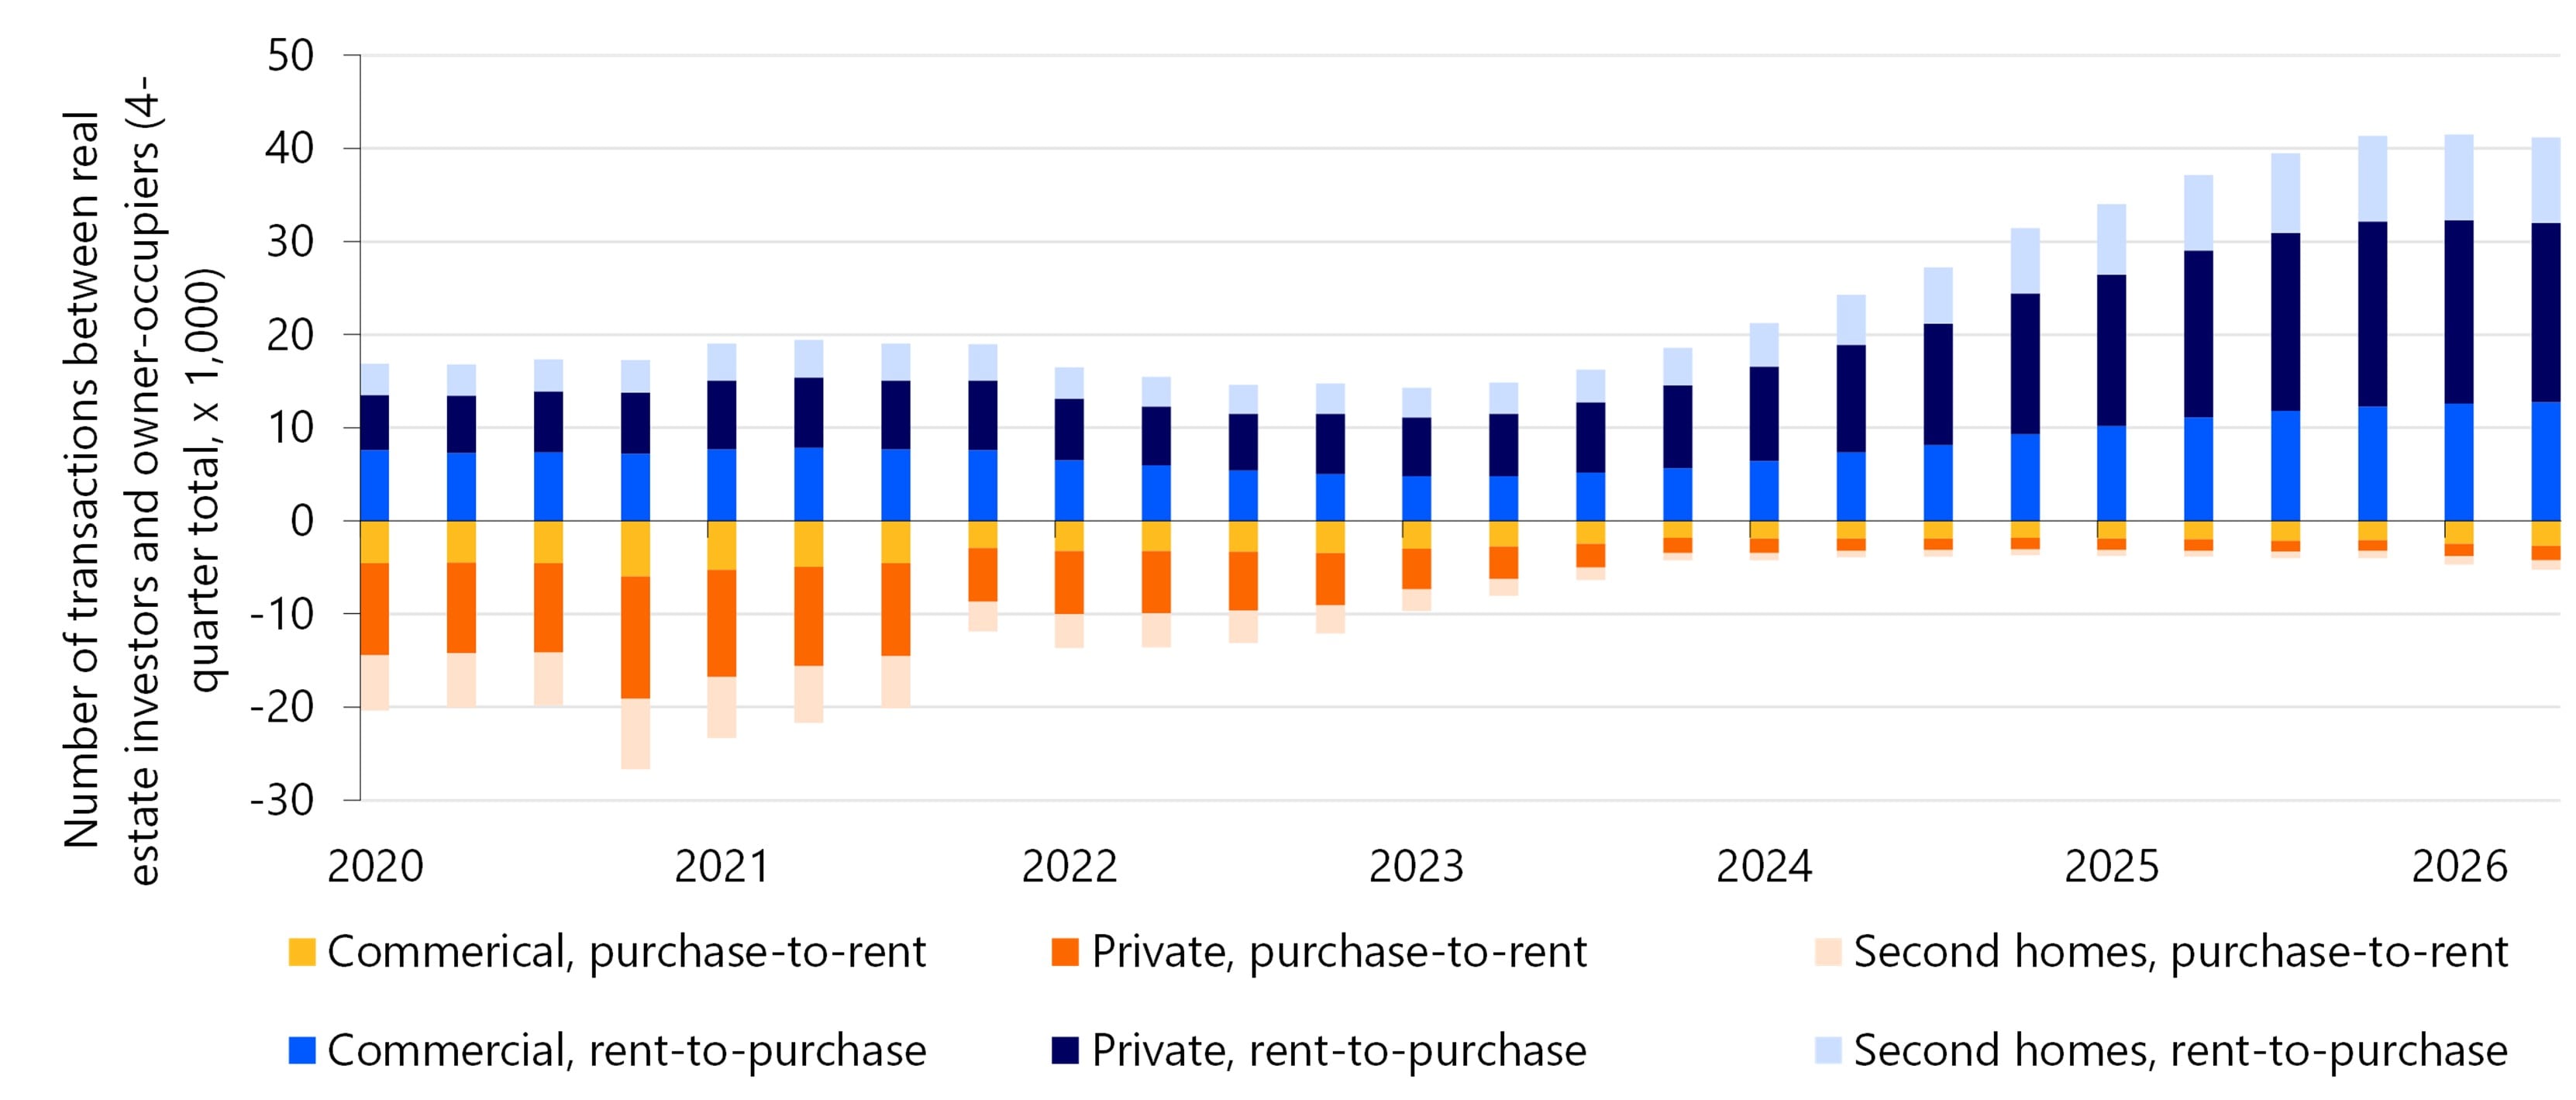
In the past four quarters, a total of 39,000 rental homes were sold to owner-occupiers; slightly below the four-quarter sum we saw in the first quarter (Figure 7). The number of sales is therefore still at a very high level, although the ceiling now seems to have been reached. Especially among private landlords we see the number of sales fall slightly. However, institutional residential investors have actually started to sell more rental properties in recent quarters.
Looking ahead, we expect the wave of rental property sales not to die out in the short term, but to gradually decrease in size from the second half of this year. Given the share of temporary rental contracts with private landlords of 50%, (in Dutch) we think that a large proportion of the rental properties they sell were let with a temporary contract. Because these temporary contracts were allowed to last a maximum of two years, the last old contracts will expire on 1 July 2026. For institutional parties that divest homes, the sale of rental homes is more phased, partly because homes are more often let via a rental contract for an indefinite period. Homes are then often sold as soon as the current tenant leaves. In the market for commercial residential real estate, there are currently many transactions in which rental housing portfolios are sold to investors with a cash out revenue model. Commercial real estate consultancy CBRE (in Dutch) expects that approximately 90% of current home purchases by institutional investors will eventually be sold.
Figure 7: Ceiling reached, but wave of rental sales not yet on its way out
Regional house price development
Amsterdam and Zaanstreek are at the bottom of the list this year
Especially in places where the wave of sales is going fast, such as the Amsterdam region, house price growth is currently moderate. Prices of existing owner-occupied homes here were only 1.5% higher in the second quarter of this year than in the same quarter a year earlier. In the Delfzijl region, on the other hand, the highest price increase was recorded in the second quarter at 10.1%.
Regional differences in house price growth will also mark the rest of 2026 (Figure 8). Looking ahead, we expect a relatively sharp division between the west and east of the country this year. For several regions in the northeast of the country, we expect average price growth of 5% or more. In frontrunners East Groningen and Southeast Drenthe, we expect existing owner-occupied homes to be about 8% more expensive this year than last year. In Greater Amsterdam and the Zaan region, the expected average house price growth will remain at just under 2%. We also expect moderate price growth in Zeeuws-Vlaanderen. In this region, the supply of many (former) holiday homes probably plays a role. This is partly due to changed tax rules for second homes.
End of the division between west and east expected
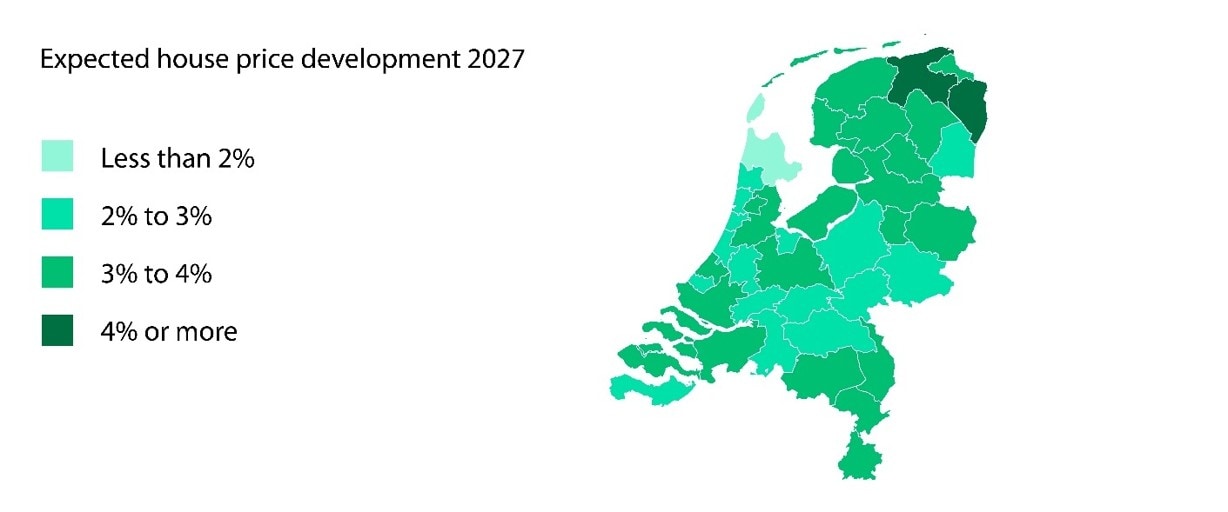
Next year, we foresee a less sharp dividing line between the east and west of the Netherlands, as the wave of ex-rental sales slowly but surely recedes (Figure 9). The anticipated decline will result in less supply, especially in (metropolitan) regions in the Randstad, and thus also in upward pressure on house prices. As a result, the difference in house price development between the west and northeast of the country will become smaller.
Figure 8: Projected price development in 2026
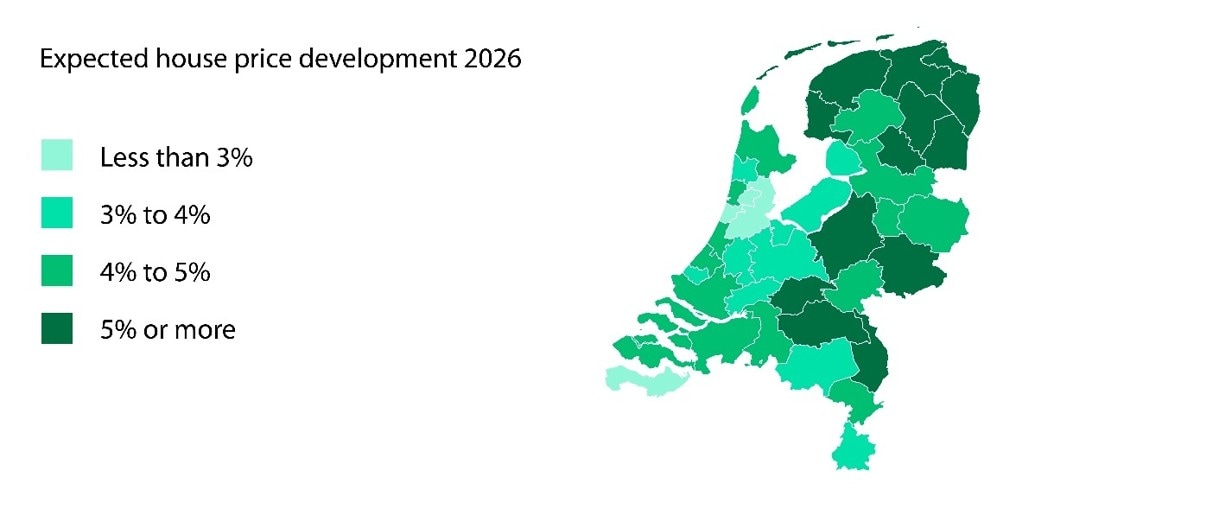
Figure 9: Projected price development in 2027
House sales
House sales near record high
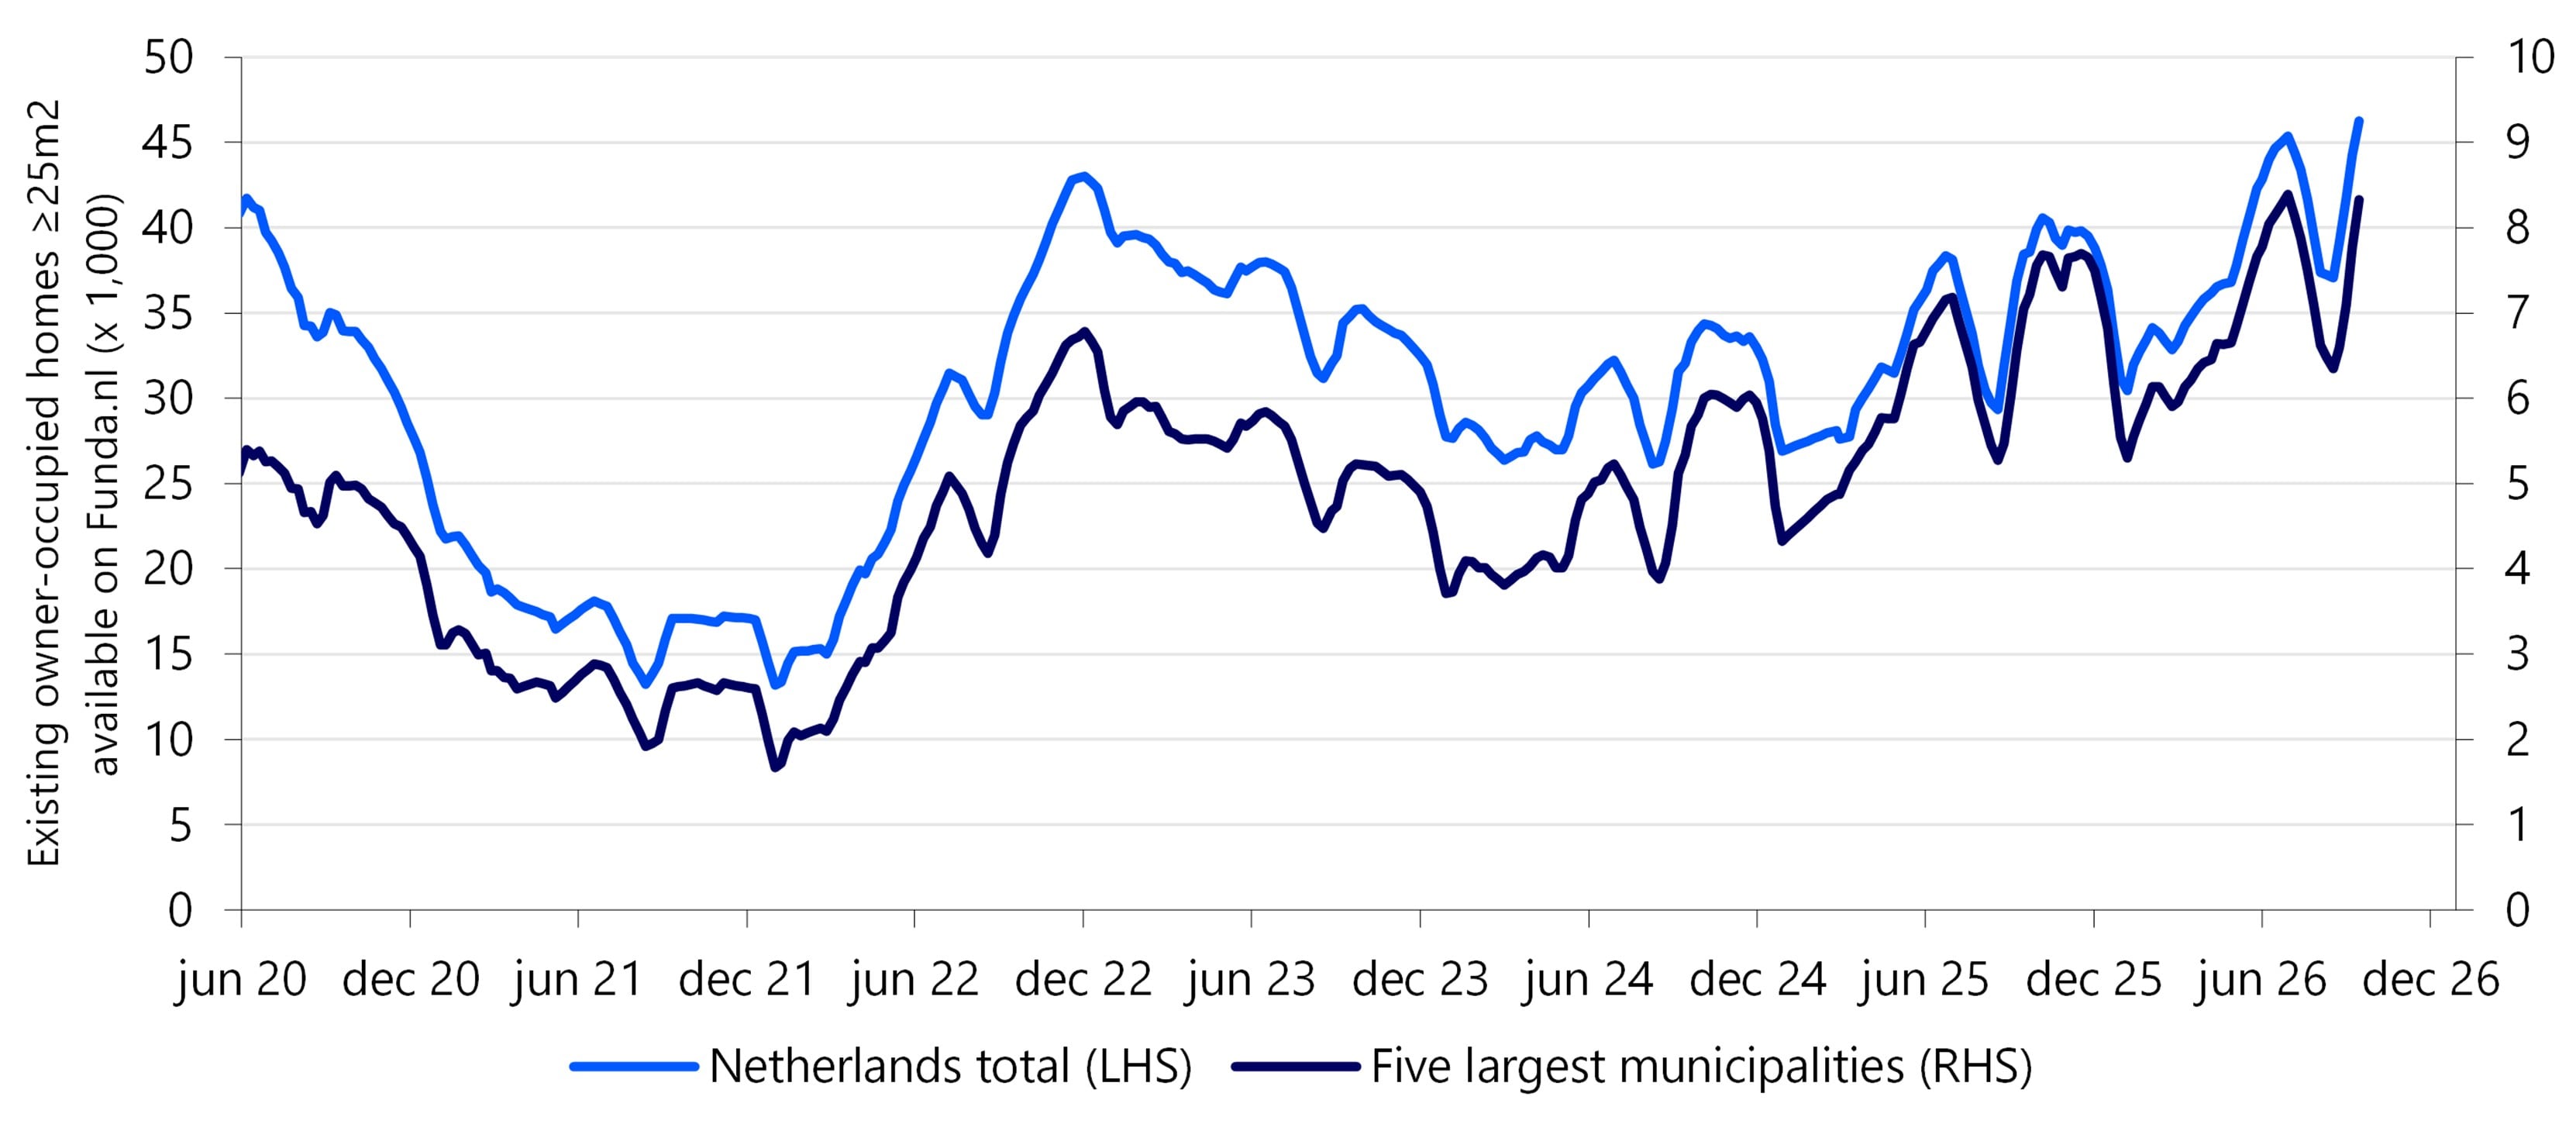
There are currently about 39,000 homes for sale on the Funda housing platform (Figure 10); just under 23% more than a year ago. Recently, many homes have been put up for sale, which is related to the wave of sales of ex-rental homes. But real estate association NVM (in Dutch) also notes that homes are being sold slightly less quickly, which contributes to the increase in the number of houses for sale.
Figure 10: More 'for sale' signs than last year
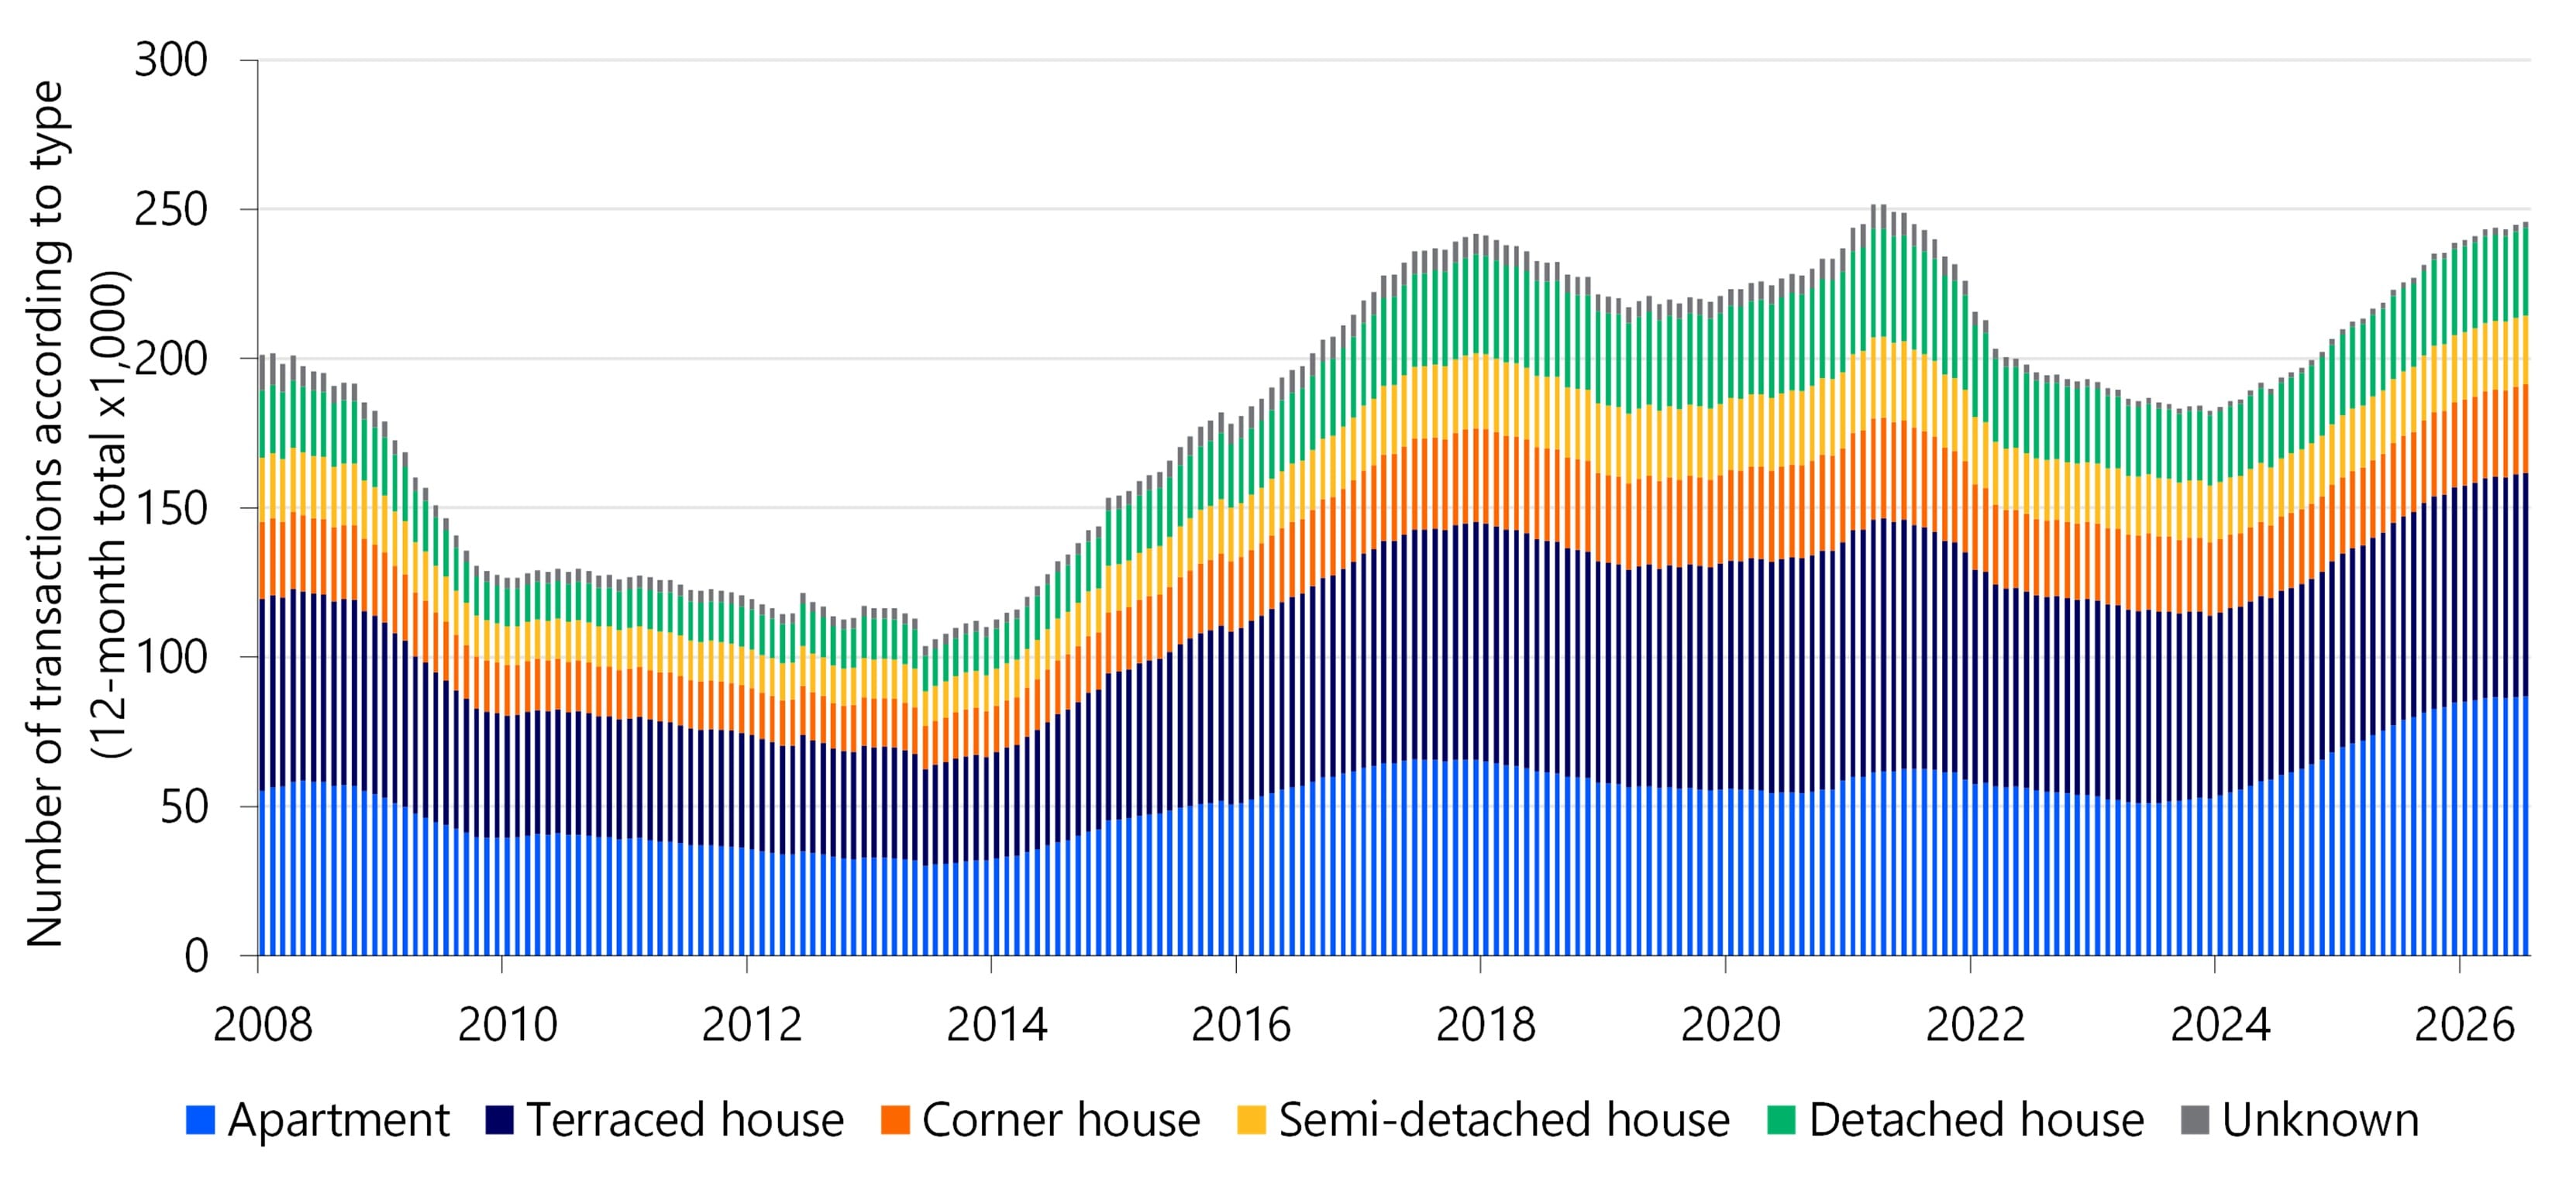
Due to the still great underlying housing shortage, most houses that come on the market are sold quickly. The extra supply is therefore also pushing up the number of home sales. In the past twelve months, almost 246,000 houses were given a new owner, which is almost a record (Figure 11). Only in the spring of 2021 did we see slightly more housing transactions: no fewer than 250,000 homes were sold. Historically, many apartments have changed hands recently.
Year-on-year, about 9% more houses have been sold in the past twelve months than a year ago. The period of double-digit growth – which we have seen in the past year and a half – now seems to be over. In the past year, growth in the apartment segment in particular fell back, which fits in with the picture that the wave of sales has reached a ceiling.
Figure 11: Still many apartments sold, but the number is no longer rising fast
Considerably more house sales this year than previously thought
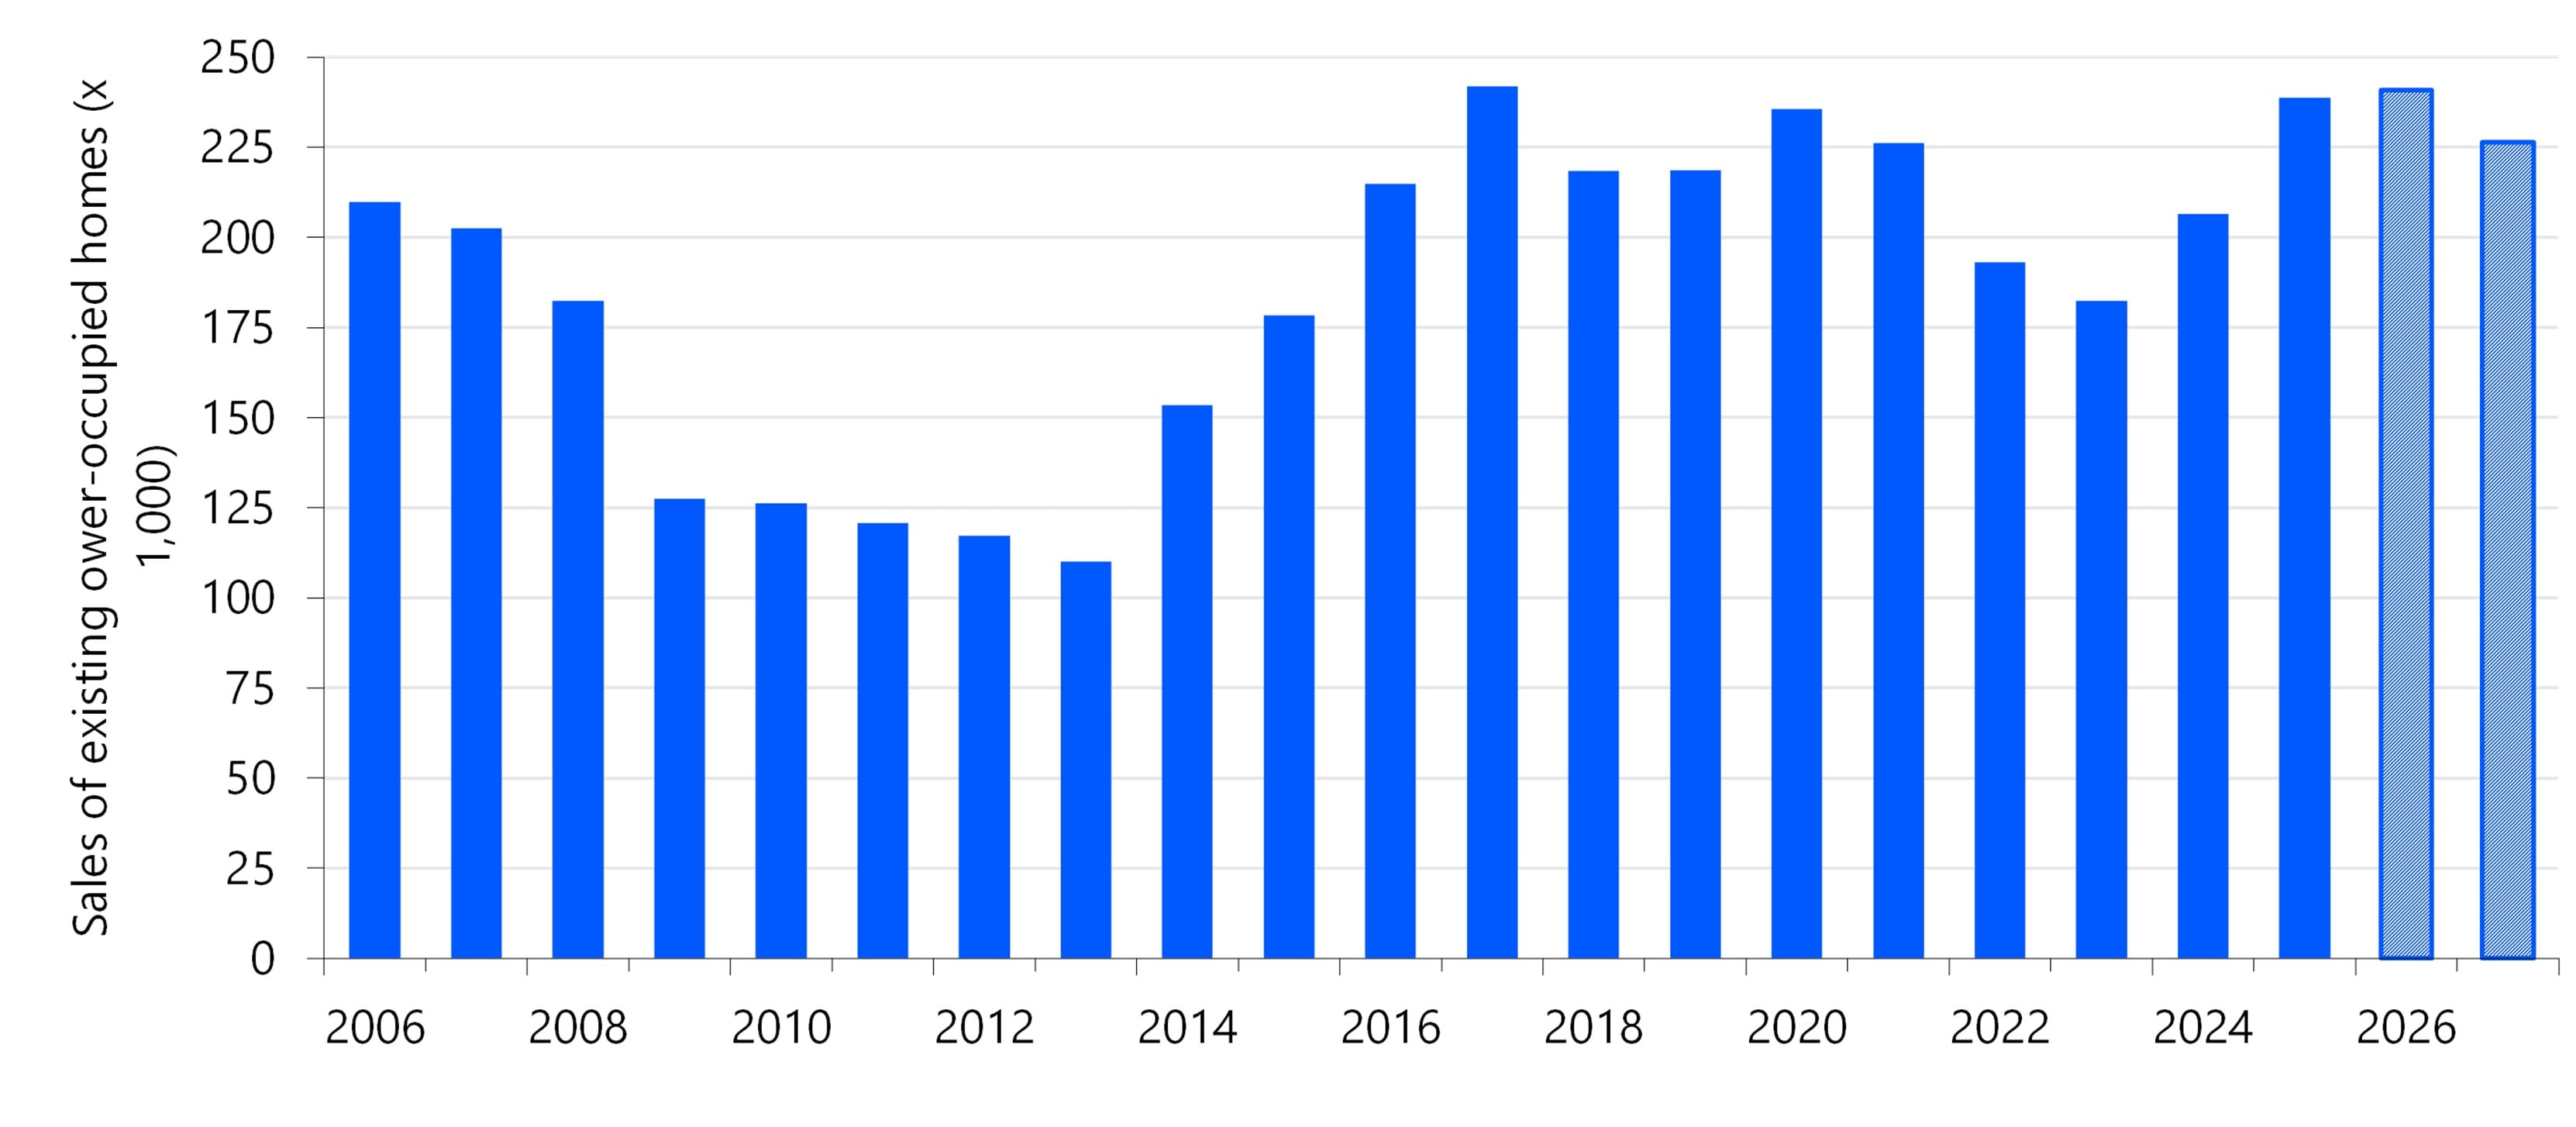
We expect 241,000 home sales this year, which is slightly more than last year (Figure 12). This means that about 104,000 transactions still have to take place in the remaining five months; about 4.6% less than the number we saw in the same period last year.
In our previous Quarterly Report, we estimated significantly fewer home sales for 2026, with 227,000 transactions. There are two reasons why we have revised our transaction forecast upwards. The wave of sales of ex-rental properties fell less sharply than we assumed, so there was more supply of owner-occupied homes. These homes were also sold faster than expected, because there was no turnaround in sales as a result of the conflict in the Middle East. Although we still expect a gradual decline in the sales of ex-rental properties this year, we have lowered the pace at which these sales will die out. Nevertheless, the gradually decreasing supply of ex-rental properties is leading to fewer houses that can be sold. For 2027, we therefore expect a clear decline in the number of transactions, with 226,000 home sales. New construction is also showing signs of stagnation, which is tempering the number of transactions of existing owner-occupied homes because there is less flow.
Figure 12: Many transactions this year, then decline expected
Housing
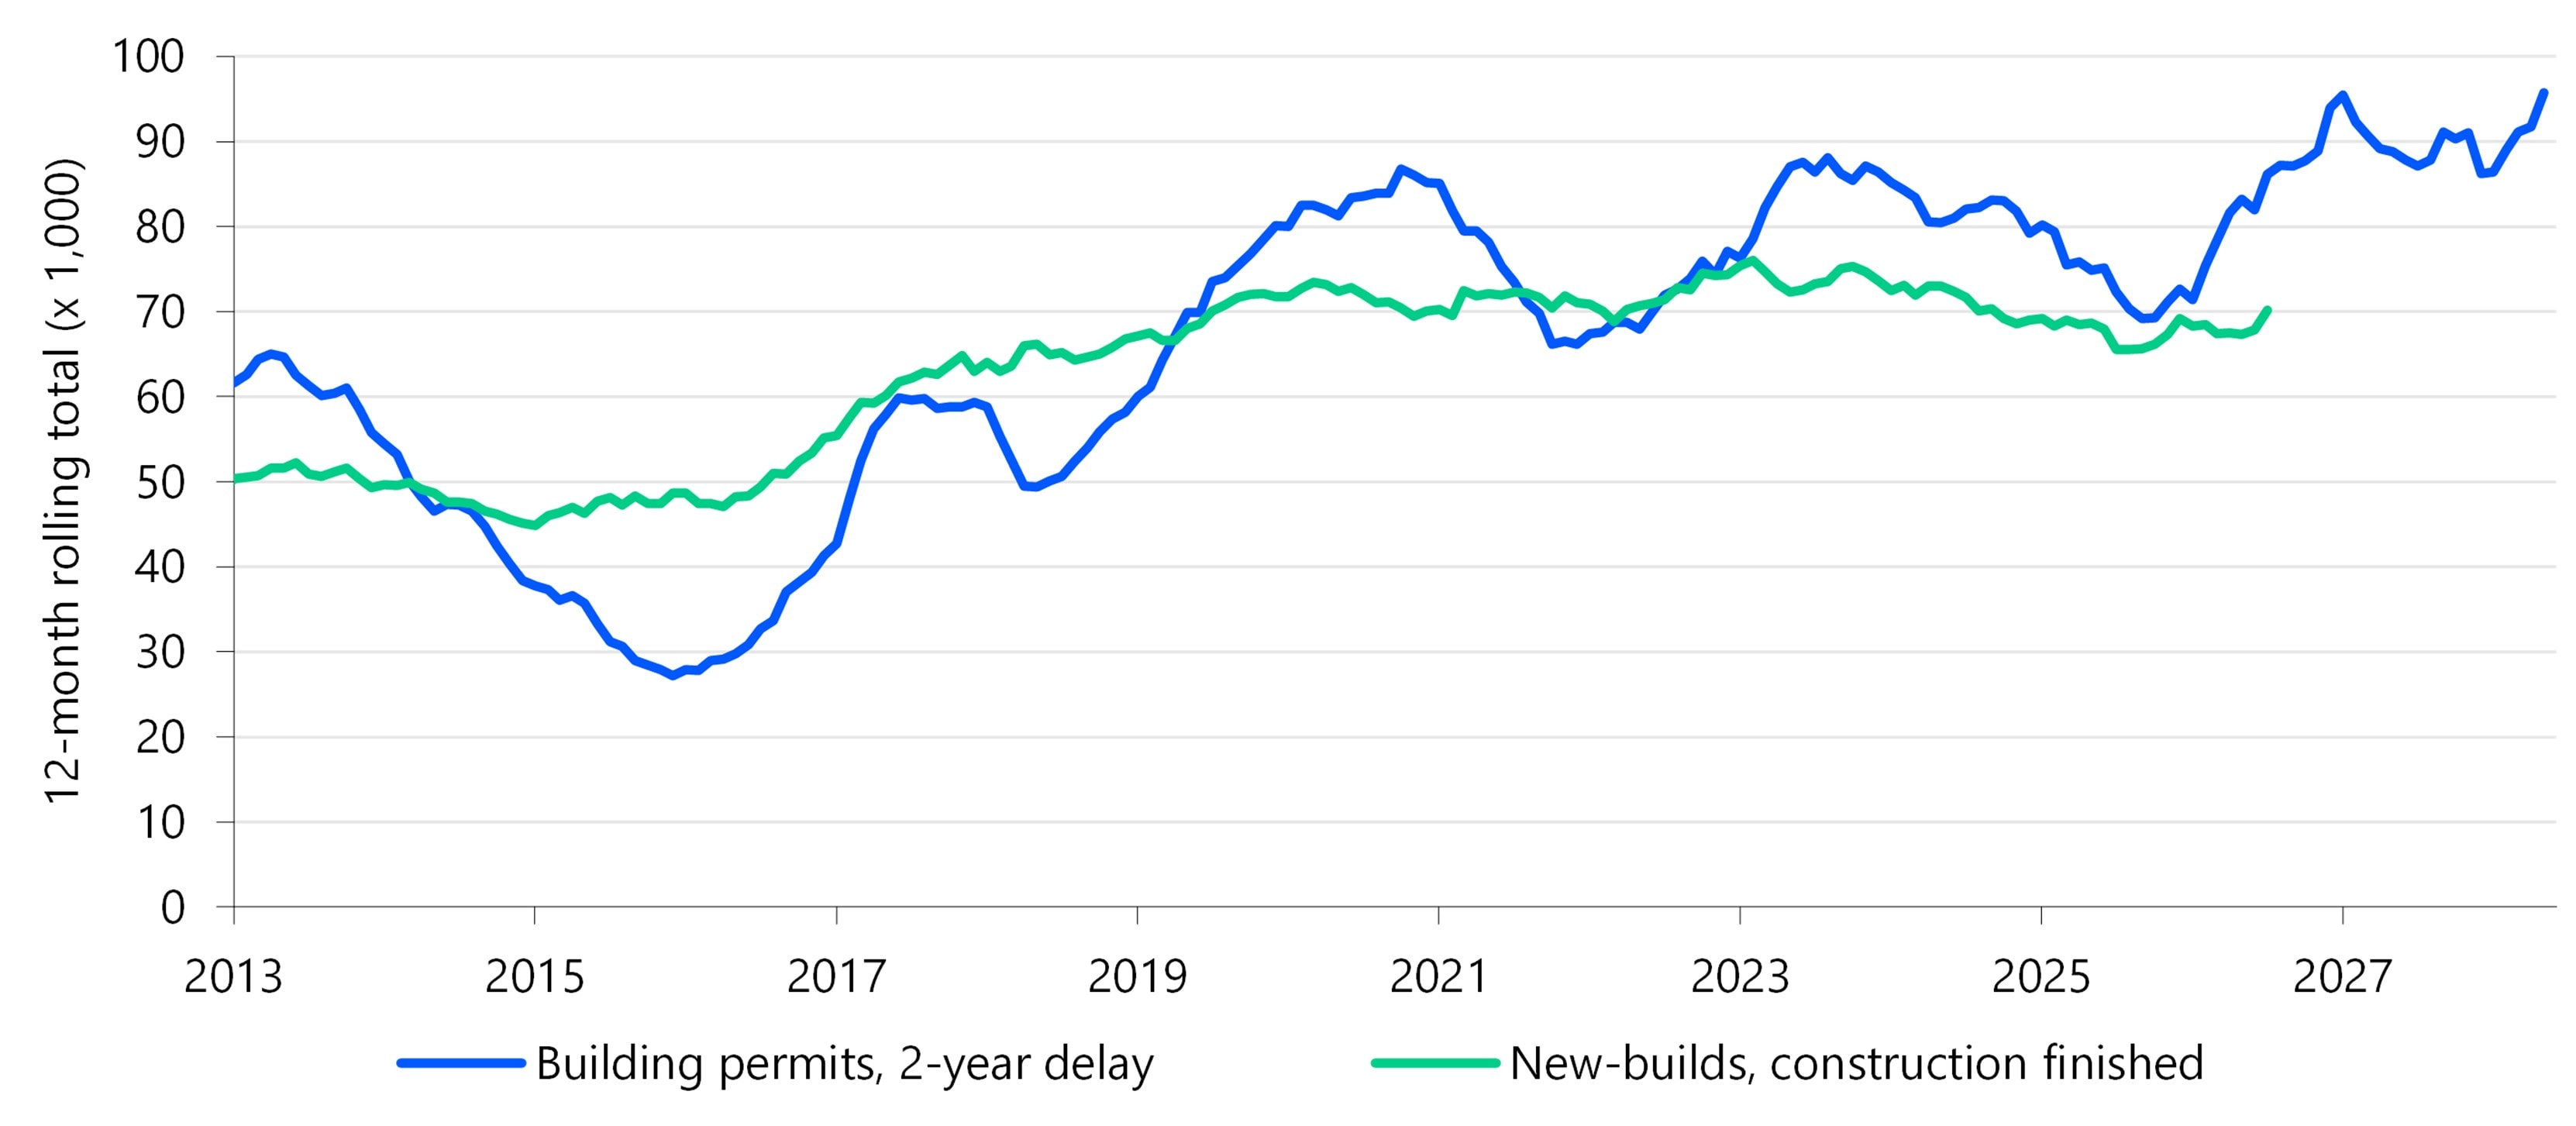
Over the past three years, the number of new-build homes completed has steadily declined. Although we expect the number of homes completed to pick up somewhat this year, we remain pessimistic about the prospects in the short and medium term. To start on a positive note: there are currently almost 234,000 homes in the pipeline (Figure 13). A very large number of them – about 46% – are actually under construction. In addition, municipalities have been issuing more building permits for new-build homes since the beginning of this year (Figure 14). In May, the twelve-month counter stood at no less than 96,000 permits. In the past eleven years, we have never seen such a high number. However, this increase gives a distorted picture of the actual development of construction activity, because builders have brought forward permit applications in connection with changing policy.
Figure 13: Record number of houses under construction
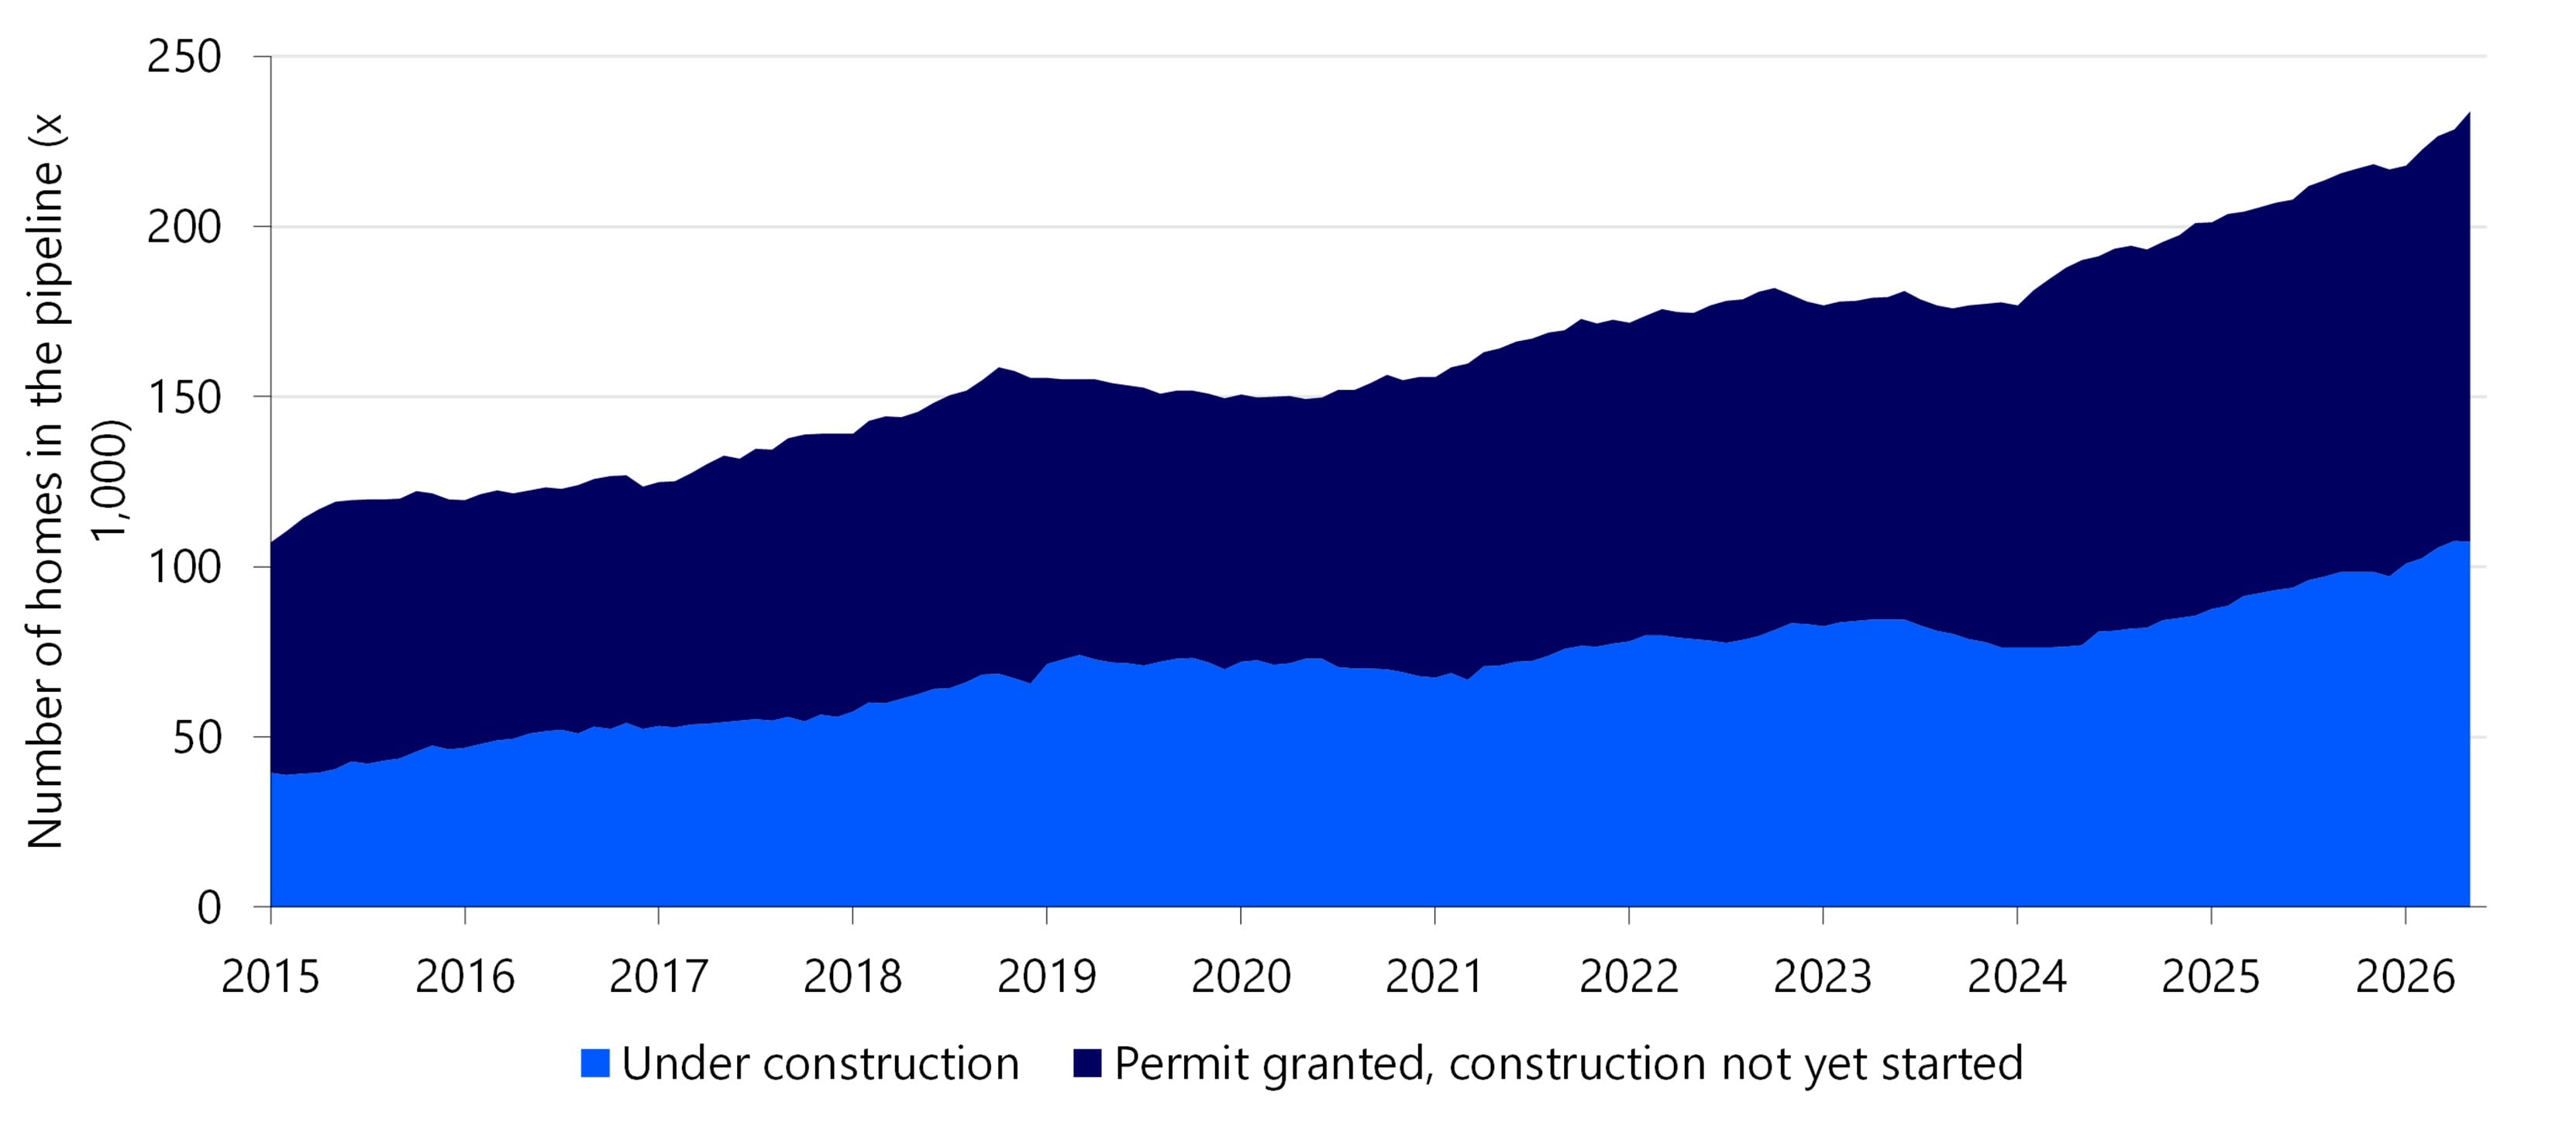
Figure 14: And also a record number of housing permits issued
More permits does not automatically mean more deliveries
The recent increase in the number of housing permits issued seems to be related to the fact that from 1 July, small-scale users (which includes requests to connect new-build houses to the grid) will also be put on the waiting list for new electricity connections if there is grid congestion. It seems that some municipalities and developers wanted to get ahead of this change, and therefore accelerated the process. For example, research by Cobouw shows that some municipalities have administered homes as 'permitted', while the permit had not yet been finalized. Statistics Netherlands did not release any figures on the number of permitted new-build homes in June and July due to an "unusually large increase in permitted new-build homes".
It is therefore uncertain when the housing plans and building permits issued will result in completed homes. In addition to grid congestion, other factors also play a role here. For example, some of the housing plans – also for 2027 – are soft. The share of soft plans will continue to increase towards 2030. And even hard plans are not always realized in the planned year, ABF Research notes (in Dutch). Housing bottlenecks such as grid congestion, nitrogen problems, objection and appeal procedures and rising construction costs can all throw a spanner in the works. The research institute points to a wave of plans that repeatedly push back a year. And in recent years, CBS statistics have also shown a growing gap between the number of building permits issued and the number of homes completed (see also Figure 14).
Sales of new-build homes fall
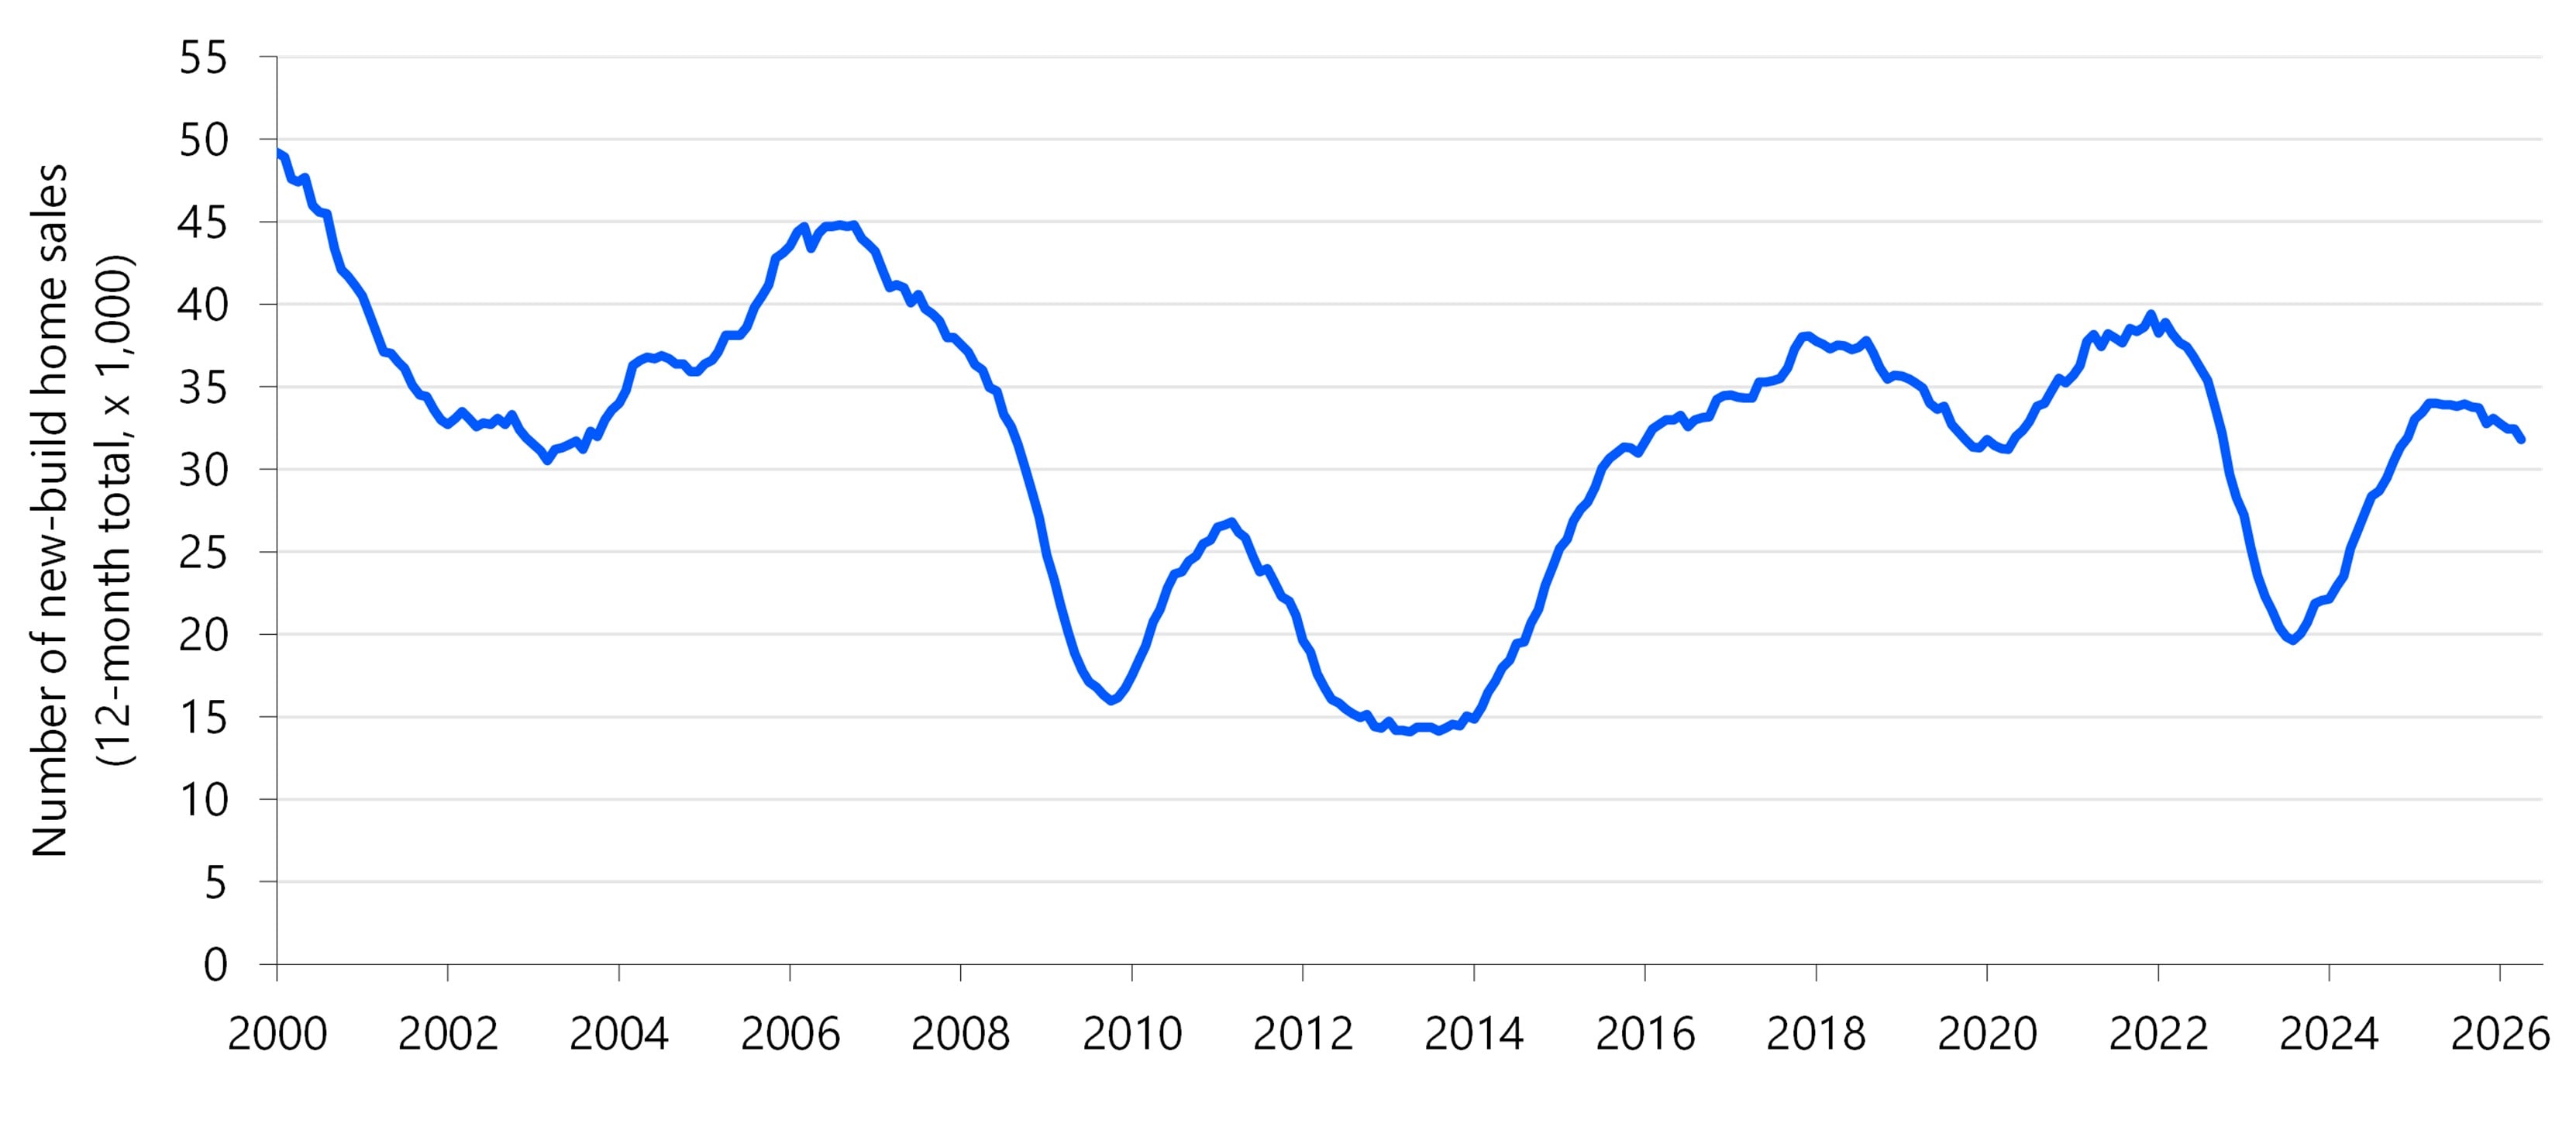
In addition, sales of new-build homes have been declining for some time (Figure 15). Based on the number of completion guarantees issued, about 9.3% fewer new-build homes were sold in the first seven months of this year than in the same period last year. The decline in sales is not (only) the result of the conflict in the Middle East; Because the trend started well before the outbreak of the conflict – mid-2025. The conflict does not help to turn the tide. However, the exact impact of the conflict on top of other structural housing bottlenecks is difficult to distill.
Figure 15: Fewer new-build homes sold
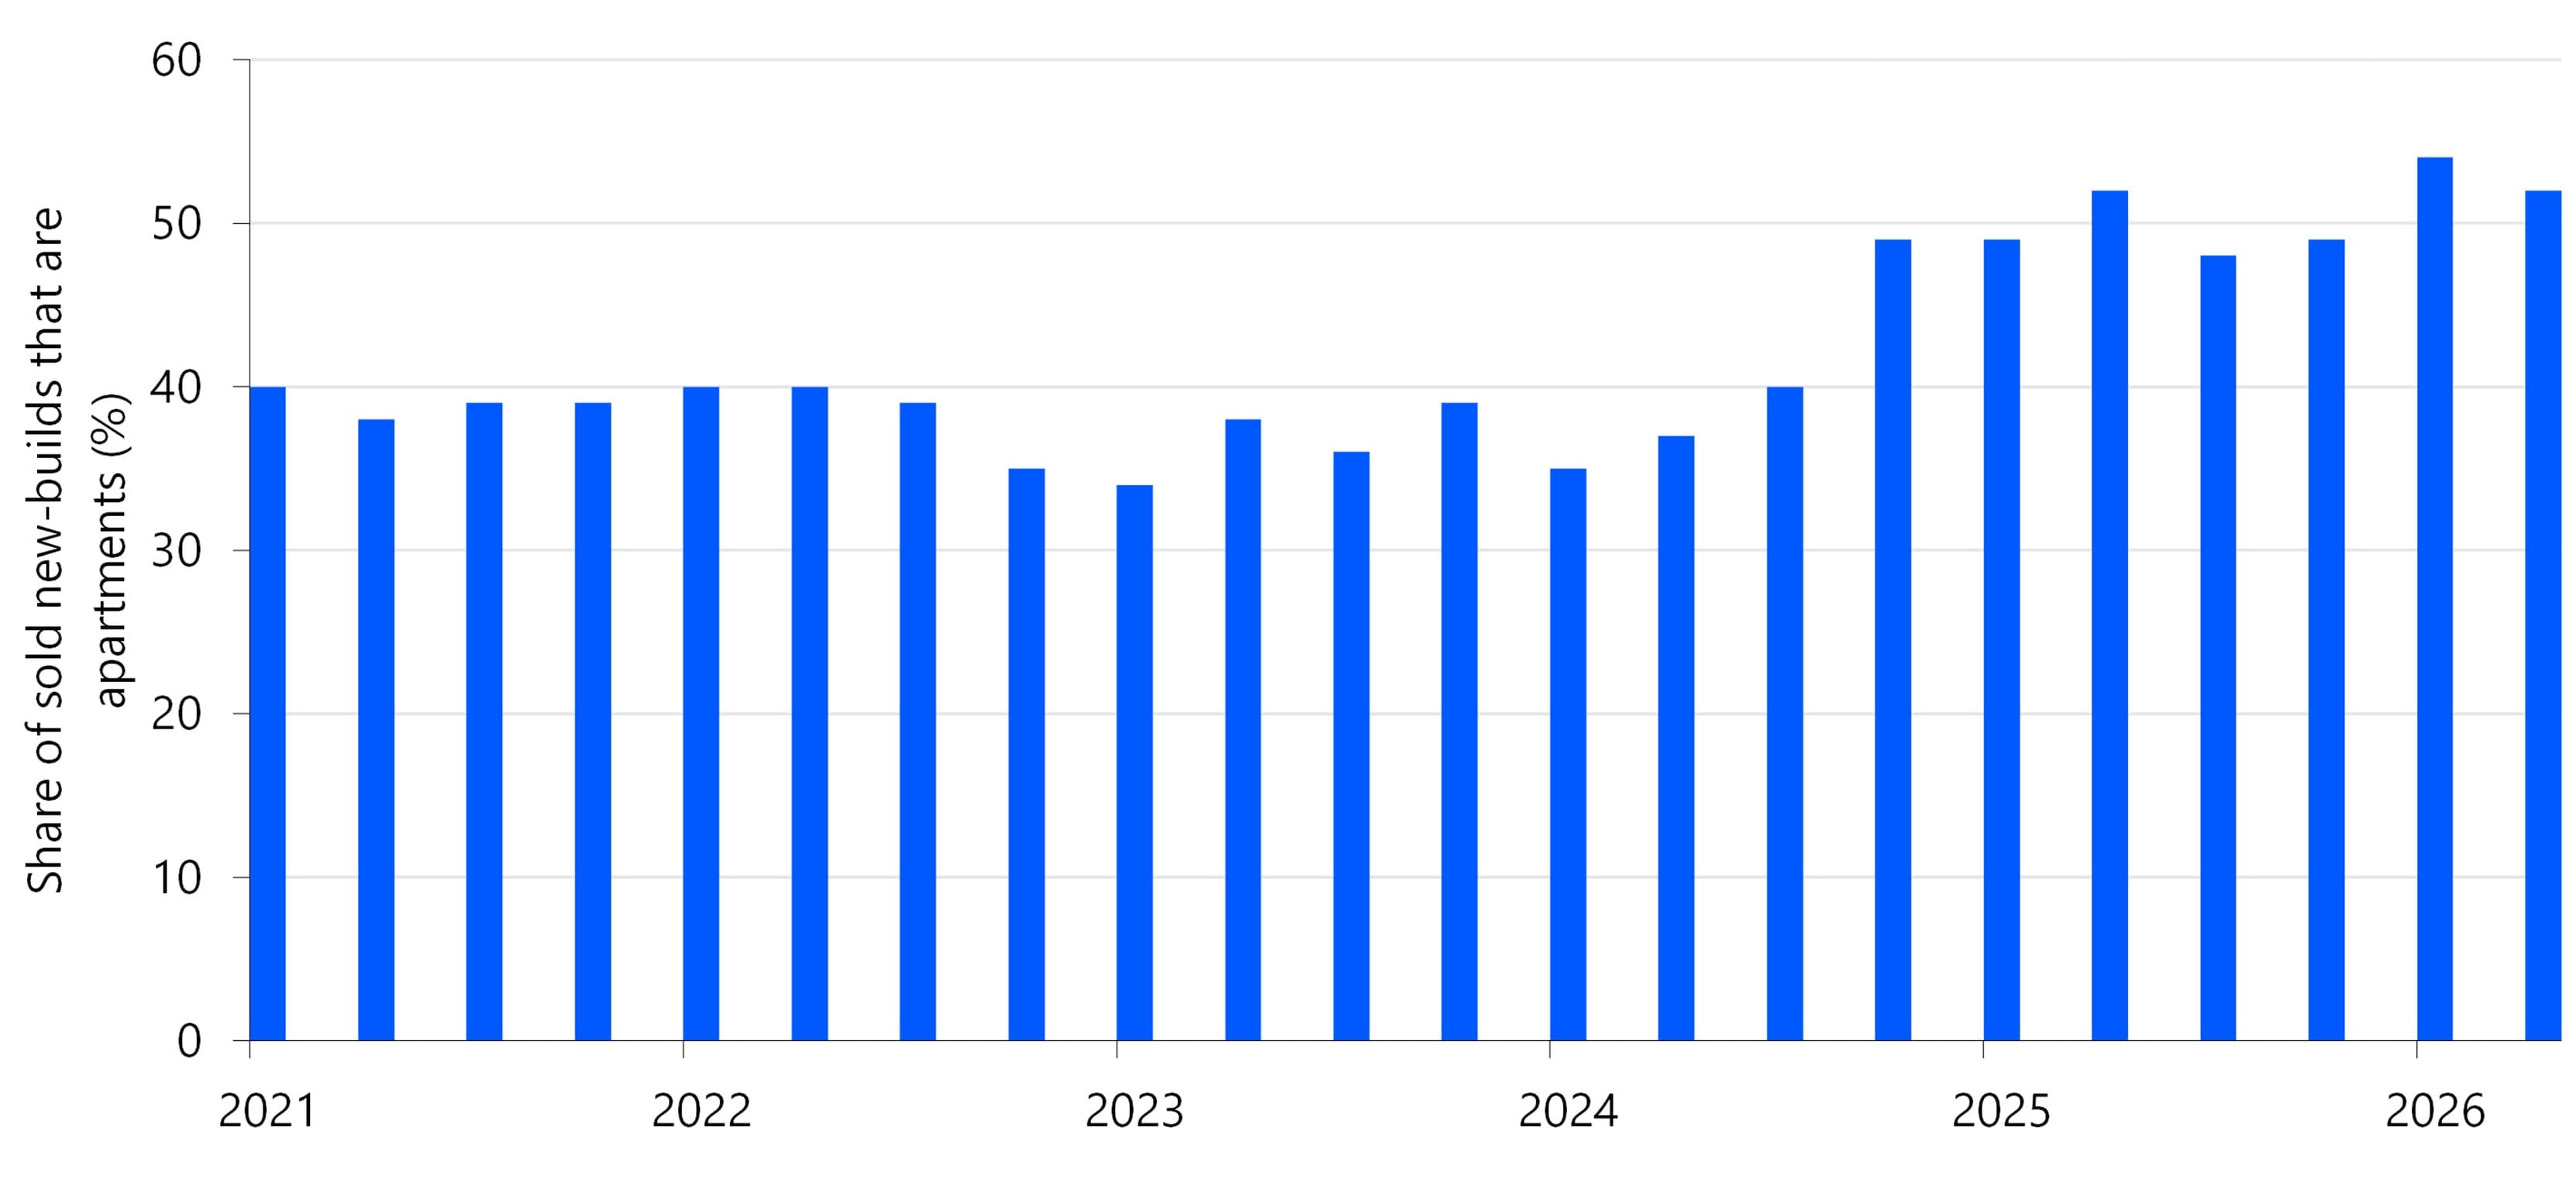
Because the sale of new-build homes is falling due to a drop in demand, more and more new homes are for sale. According to the NVM, this mainly concerns new-build apartments (in Dutch). It notes high demand for ground-level housing, while the focus on new construction has increasingly shifted to apartments in recent years (Figure 16). This assumed mismatch between supply and demand poses a risk to the saleability of new-build owner-occupied homes. And looking ahead, the latter trend does not seem to be coming to an end for the time being. An inventory of the housing plans by ABF Research shows that of all planned homes for which the housing type is known, about 70% are apartments (in Dutch). The share of apartments is particularly high in the Randstad provinces of North Holland, South Holland and Utrecht.
Figure 16: New-build homes are increasingly apartments
Highlighted: affordability of owner-occupied homes remains a problem
Households with a median income are about EUR 80,000 short of an median-priced owner-occupied home
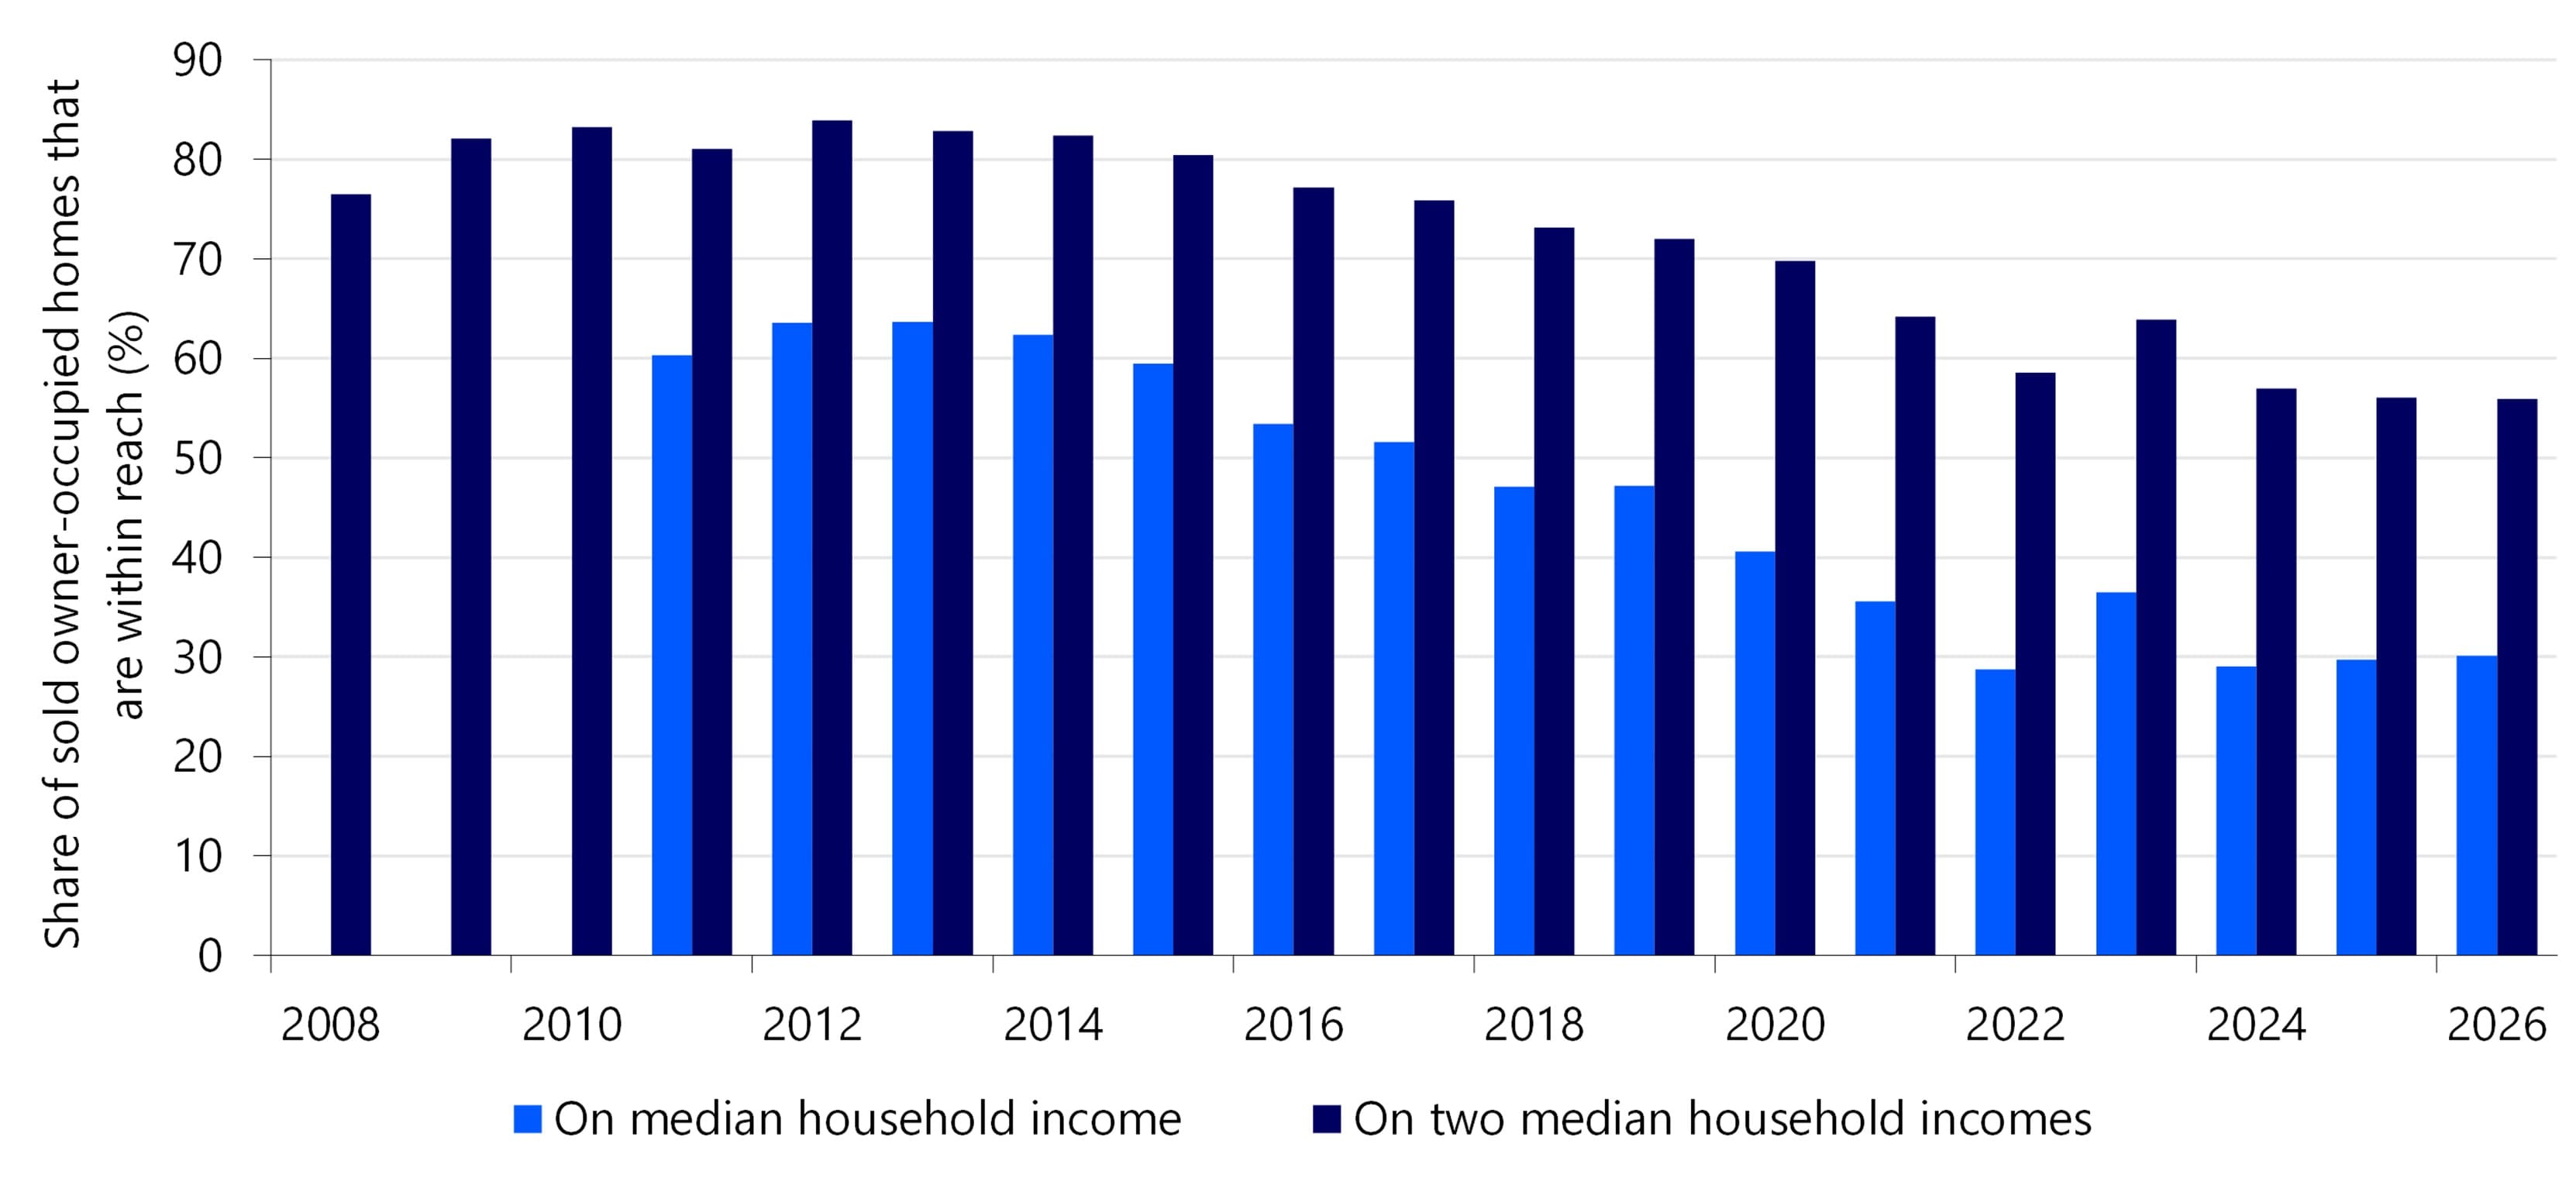
A household with a median household income is expected to be able to borrow more than EUR 360,000 this year based on its income. That is estimated to be about EUR 80,000 too little for an median-priced owner-occupied home, which costs about EUR 440,000.
Nevertheless, the share of financially accessible homes has remained fairly stable over the past two years, after a long period in which the affordability of owner-occupied homes deteriorated sharply (Figure 17). Looking at all the homes sold in the first half of this year, we see that about 30% of them were financially accessible to a household with a median household income. Only in 2023 did financial accessibility rebound significantly as a result of falling house prices at the time, but it didn't take long for its recovery to reverse this.
Figure 17: Financial accessibility did not deteriorate further in 2025 and 2026
Even a modest terraced house is often not accessible with a median household income...
Owner-occupied homes with a transaction price around the median are often single-family homes, and the average surface area is 109 m2 – calculated over all owner-occupied homes sold, including apartments. Many first-time buyers are therefore not so much looking for the median owner-occupied home: the question for them is whether they can get hold of a home at all. That is why we investigated the affordability of a modest apartment or terraced house in different regions.
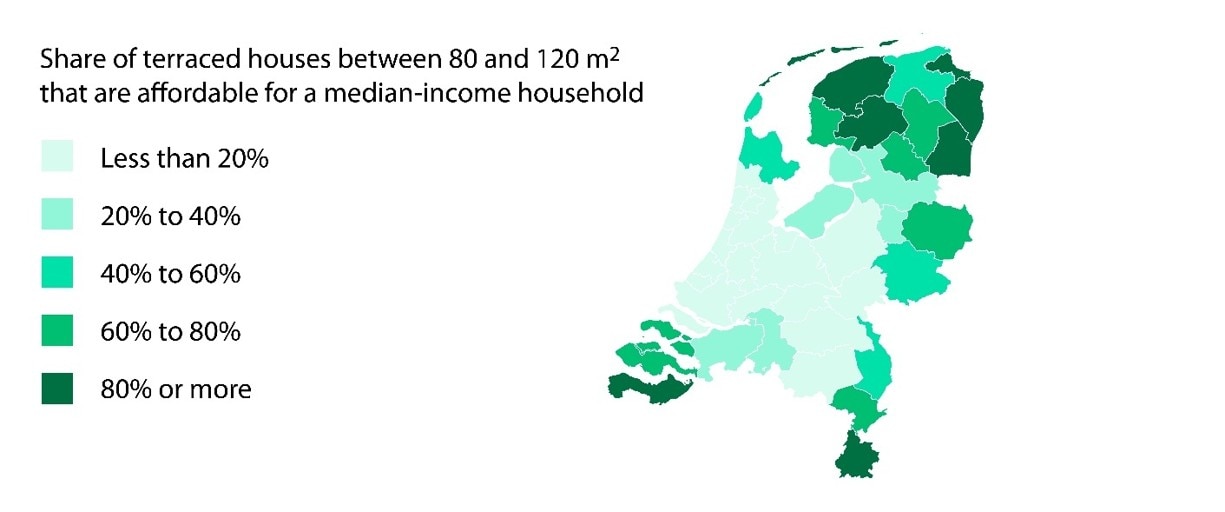
In large parts of the Randstad, a median household income is not enough to finance a terraced house of 80 to 120 m2 (approximately up to the national average) (Figure 18). In Amsterdam and the surrounding area and the Utrecht region, the share of financially-accessible terraced houses with this living space remains at 2% or even less. This is in stark contrast to regions on the edges of the Netherlands. In regions such as Zeeuws-Vlaanderen, Oost-Groningen, Delfzijl and the surrounding area, more than 94% or more of the modest terraced houses are financially accessible to households with a median household income.
Despite the poor affordability of single-family homes in some places, according to the triennial Housing Survey Netherlands, almost two out of three prospective first-time buyers with an income of one to one-and-a-half times the median income do prefer this type of home. This group cannot rely on equity for financing, but mainly has to rely on their own income, or – increasingly – financial support from parents.
Figure 18: A modest terraced house is a bridge too far in large parts of the Randstad
… But a median household income is sufficient for a modest apartment almost everywhere
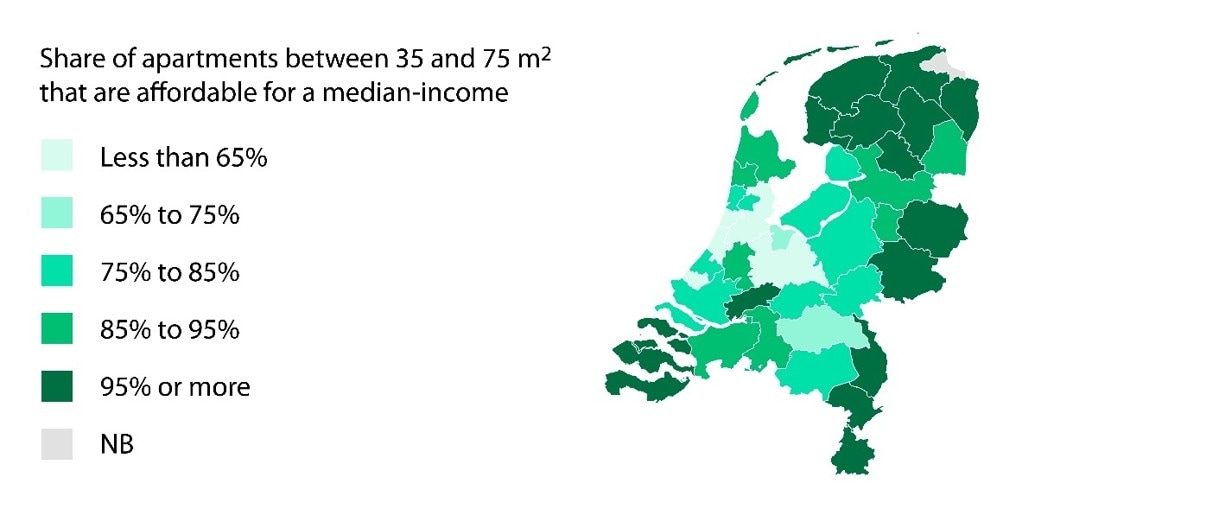
Modest apartments (with a living area of 35 to 75 m2, again cut off at about the national average) are often financially accessible in large parts of the country for households with a median household income (Figure 19). In the past twelve months, this applied to 61% of the apartments sold of that size. In regions on the edges of the Netherlands, almost all owner-occupied apartments sold between 35 and 75 m2 are within reach. In the regions of Amsterdam and Utrecht and the surrounding area, it is a different story. Here you will get less far with a median household income. In Greater Amsterdam, which ranks last, the share even remained at 15%: the (further) scaling back of their housing preferences may therefore not offer home buyers a solution.
The fact that households with a median household income in regions on the edges of the country can usually theoretically buy a modest apartment seems at first glance to clash with the sentiment that owner-occupied homes are also difficult to reach for first-time buyers. However, it should be borne in mind that by no means all young adults have access to a median household income. Young people earn less on average, and incomes are usually lower at the edges of the country.
Figure 19: In large parts of the Netherlands, a modest apartment is within reach