Research
Looking beyond the COVID-19 crisis


While we currently expect a V-shaped recovery for the global economy, there is a clear risk of a more U-shaped or even L-shaped recovery. There could also be effects on global growth beyond the 2021 horizon. We expect annual structural growth (up to 2030) in the US to drop from 1.6% to 1.4%. For the Netherlands, structural growth is set to decline from 1.3% to 1.1%.

Summary
The shape of things to come: V U, W or L?
Given the size and swiftness of the shock that the world economy is currently experiencing, what shape will the recovery take once it exits the COVID-19 crisis? This is the key question that we discuss in this Special. When we published our Global Economic Outlook projections (in early April) we assumed a lockdown in most countries between three and eight weeks. So the focus was on the impact of that lockdown, the mitigating measures by governments and central banks and certain dynamic productivity effects in the aftermath of the crisis. While we assumed a gradual return of economic activity post-COVID-19, we acknowledged that such a trajectory would be surrounded by considerable uncertainty. That uncertainty stems not only from the significant supply impairments currently being experienced but also from the demand shock that will follow as people lose their jobs and confidence is shaken.
We start with a stylistic representation of the current COVID-19 shock to the economy and examine how this could affect both the future level of economic activity and the growth trajectory. We look at the issues from various angles, in particular from the driving factors of economic output: labor, capital and productivity. There is ample evidence to suggest that an economy’s growth trajectory is adversely impacted long after a crisis. To gauge the potential impact of these factors and what they mean for the future shape of the recovery, we take the example of the US and Dutch economies. Since the US has a large, relatively closed, economy and the Netherlands a small, open economy, these two cases illustrate the bandwidth of economic outcomes after COVID-19. In fact, it turns out that the outcomes are quite similar, which suggests a certain robustness of our results.
Will it be a V-, U-, W- or L-shape recovery?
Let’s first take a closer look at the contours of this COVID-19 economic shock. The four letters in the header of this paragraph are often used to depict the path of the economy as it goes into a recession and then exits from that downturn. In both our baseline and extended lockdown scenarios that we published in early April, we assumed the recovery from the corona crisis in 2021 to be relatively steep. This implies that the GDP trajectory would essentially be V-shaped, with a sharp decline of GDP growth in 2020 followed by a sharp rise in GDP growth in 2021[1].
While we assumed a period of ‘gradual return’ of supply in the immediate aftermath of the lockdown, this recovery hinges on the following premises; that the lockdowns are successful in containing the virus and therefore remain limited to Q1 and Q2; that there would be no re-emergence of the virus in 2021 requiring new lockdowns; and that the financial system and supply side of the economy would survive the current crisis largely unscathed. This scenario could be metaphorically labeled as a ‘lightning switch crisis’: parts of the economy are switched off temporarily, it then rebounds relatively quickly with only limited damage inflicted on the growth potential of the economy during and after that rebound.
While both our baseline and ‘extended lockdown’ scenario (where we added another three months to the limitations on supply) were essentially of that type, one can also imagine a situation where that V-shape becomes much more stretched into a U-shape (for example a longer-lasting runway before the economy recovers to its former output level), a W-shape (where the economy enters a double dip after its first recovery before returning to its old level of activity), or even an L-shape where the level of GDP not only stays lower permanently but where the subsequent growth trajectory is also much more subdued.
[1] On a quarterly basis, for choice, it would look a bit more like a U-shape, or, in the case of the US, a W-shape.
Figure 1: Stylistic view of the corona-economic shock and GDP level

A complex mix of supply and demand shocks
The current economic shocks that COVID-19 is causing are a complex mix of supply and demand shocks that interact with each other. This is illustrated in Figure 1[2]. Starting from the lockdown (Phase 1), which causes severe disruptions to supply, demand is at first predominantly impacted by confidence effects. However, in the course of the lockdown, job and income losses will increasingly weigh on the economy. So even when the economy enters a phase of lifting the supply restrictions (Phase 2) – which raises output – weak demand could still dampen that recovery as consumption is likely to be restrained by past and ongoing job and income losses. Businesses, meanwhile, need time to strengthen their cash positions before they can invest again. The availability of credit could also become a more pressing issue if banks have been hit by rises in non-performing loans. In the third phase both recovering supply and demand should essentially work in the same direction again, supported by government stimulus measures. But in this phase the scars of the shock will continue to affect the economy through their impact on labor, the supply of capital and productivity. Delays in getting the coronavirus under control could be one reason. The indirect economic impact of the lockdown and subsequent social distancing measures should not be underestimated either. Many businesses will not survive or will accumulate huge debt burdens, and many households will face loss of income and employment. While the supply effects are prevailing at the moment, the demand effects could last for years.
So, coming out of the corona crisis, economic activity is affected in two ways. Firstly, we see a drop in the level of gross domestic product (GDP), secondly we see a change in the economic growth rate. This is shown in Figure 2 below. The level shift in GDP (per capita) is related to two factors: labor market effects and a decline in investment. Changes in the growth rate of the trajectory are related to damage to three factors: labor, capital and productivity, with the latter being the most important.
In the next section we summarize how this could affect the recovery path in 2021, looking at these three factors. We will use the US and Dutch economies as an example. In the last section of this piece we will zoom in more closely on some of the theories behind these factors.
[2] Even more so bearing in mind that many economies were not in great shape at the end of 2019/early 2020.
Figure 2: Recovery after the corona crisis in theory

Figure 3: Discouragement is a serious problem in times like these

How will global economies shape up in 2021 and beyond?
New scientific studies show that even in the event of apparent elimination of COVID-19, containment measures of some form may have to stay in place for several years to come. Together with the possibility that – via knock-on effects – demand remains subdued in 2021, this means that output may not return as quickly and as sharply to its pre-COVID-19 level. Indeed, the short-term recovery would end up showing a U- or even L-shape rather than a V-shape.
Moreover, the growth trajectory beyond 2021 is also likely to be less favorable than the potential growth trajectory for non-corona scenarios. Essentially this is because supply in the economy grows more slowly due to lower investment growth, adverse productivity effects and a persistent shock to labor supply (which is largely driven by worker discouragement). So let’s zoom in on these factors below and apply our assumptions specifically to the US and the Netherlands.
Labor market impact
The labor market plays a central role in determining the shape of the recovery. First of all, it may take time before people, previously laid off, will be able to find a new job again. The speed of this recovery is partly determined by labor market institutions. Moreover, as some workers fail to find jobs quickly they may lose their skills or even become discouraged and withdraw from the labor market altogether: for example, by going back to school or opting for early retirement. The deeper the downturn, the bigger this effect (see Figure 3). Moreover, ‘scarring’, for example due to youth unemployment, or permanent impact on the accumulation of human capital, could also weigh on future growth. When applied to the US and the Netherlands, for the recovery beyond 2021 we assume that the ‘discouraged worker’ effect shaves off 1.6ppts of labor participation rates in our baseline and 2.5ppts in our extended lockdown scenario. Moreover, this adverse effect persists for over a decade. We have not explicitly taken into account any ‘scarring’ effects. In this sense, the long-term implications on the labor market that we factored in are relatively mild, and our assessment can be regarded as relatively conservative.
Impact on the capital stock
Uncertainty also leads to lower investment. A shift in investment from one sector to the other and a deep economic downturn could even lead to capital destruction. This is likely to be particularly relevant as businesses may try to reduce their reliance on inputs from China, and investment may shift from the physical to the digital domain. This could lead to a loss in network effects. Should demand not return sufficiently quickly, this is likely to lead to credit losses, which, in turn, could lead credit suppliers to ration the availability of loans. This would significantly deepen the downturn and make its recovery more shallow. Finally, we cannot rule out that risk aversion among the ‘COVID-19 generation’ leads to a more permanent effect on future investment growth. All in all, the capital stock is likely to grow more slowly in future. Applied to the US and the Netherlands, we end up with trajectories for the capital stock as shown in Figures 4 and 5. In the extended lockdown scenario the US capital stock even falls as a result of capital write-offs. Although financial constraints will definitely arise in our extended lockdown scenario and banks will face stronger headwinds, our scenarios do not take into account a full-blown financial crisis.
Figure 4: Capital stock in the US

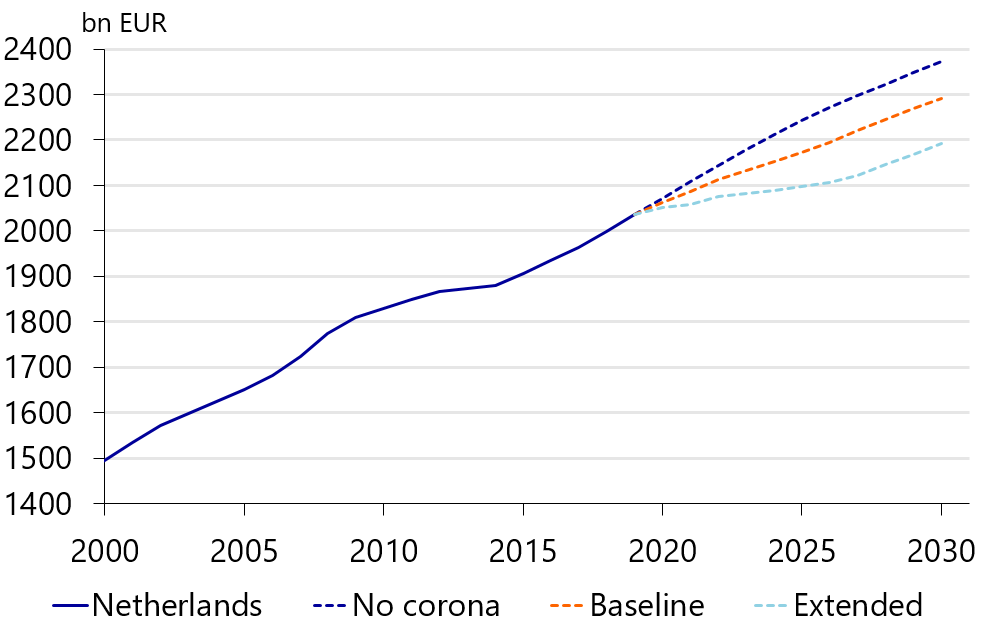
Figure 5: Capital stock in the Netherlands
Productivity impact
The most important driver of the economic growth rate after a severe crisis is productivity growth, more specifically total factor productivity (TFP). TFP is an indicator of technology in the broadest sense of the word, as it indicates how productive both capital and labor are in generating value added. It is also the most uncertain factor post-corona. Geopolitical challenges and changes in business models may have both negative as well as positive effects on the future growth rate. If government and central bank interventions lead to a decline in market forces, which could increase the numbers of inefficient businesses and financial institutions (‘zombies’). Faster digitization, on the other hand, may spur TFP growth. There is also evidence that in case of a financial or political crisis, future growth could be substantially lower for a long period of time.
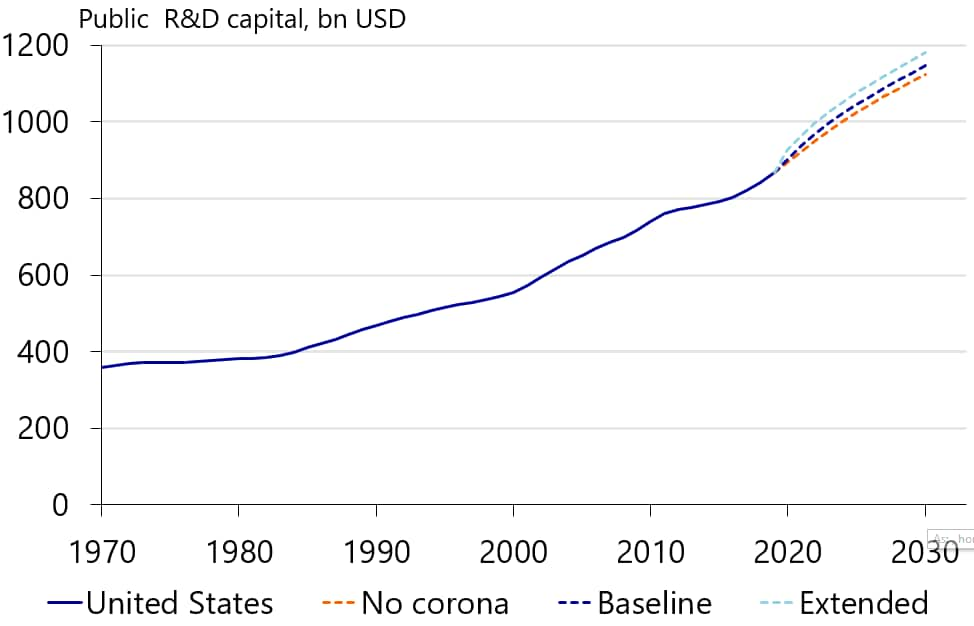
We expect lower productivity growth in the aftermath of COVID-19 due to a number of reasons. First, due to cash flow constraints and higher operating costs, firms will be forced to critically re-assess budgets for Research & Development (R&D). At the same time, we would expect public R&D expenditure to receive a boost due to joint efforts to find a vaccine for the virus and provide more fundamental solutions in a post-corona society. Applied to the US, Figures 6 and 7 show the trajectories in the lockdown and extended lockdown scenarios.
Figure 6: Private R&D capital in the US
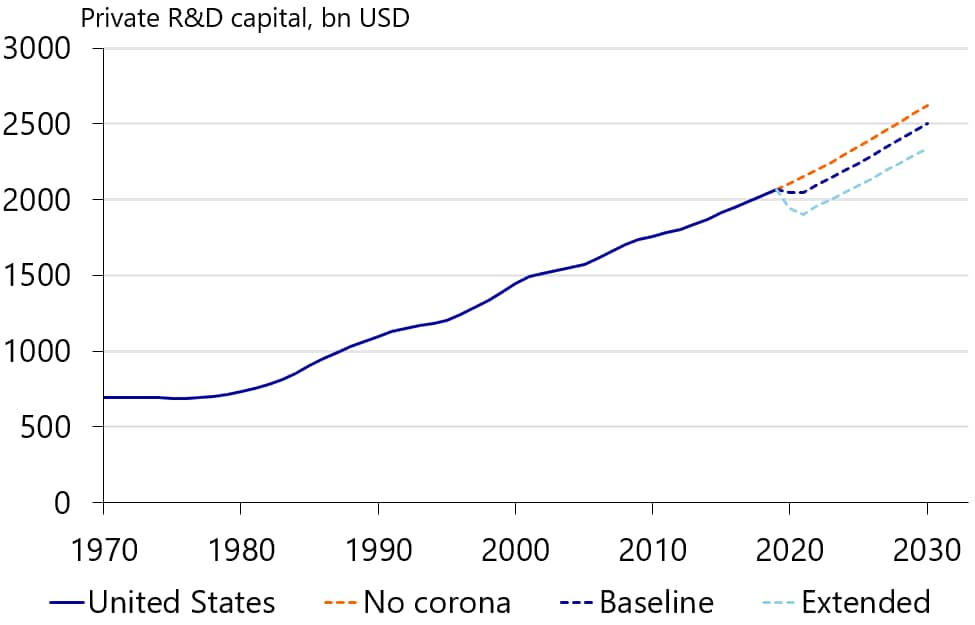
Figure 7: Public R&D capital in the US
What also will weigh on productivity going forward is a retraction of globalized dispersed value chains. As result, economies are likely to become less open (see Figures 8 and 9)[3]. Even before corona, we forecast that globalization would partly reverse due to the US-China trade tensions and US attempts to undermine the World Trade Organisation (WTO). The corona crisis, in our opinion, will only serve to speed up the process of reshoring activities currently performed overseas by multinationals as integrated supply chains unravel. Although this might bolster resilience of (domestic) production going forward, it will automatically raise the costs of production. It will also come at the expense of future productivity growth, as lower exposure to trade weighs on global knowledge spillovers and results in less international competitive pressure.
[3] The openness of the economy is defined as exposure to foreign trade (= export intensity + (1-export intensity/100)*ratio of imports to domestic demand). In a second step we adjust exposure to foreign trade for size of countries using this equation by Donselaar (2011): ln(y) = ln(trade exposurei)+ 0.22 ln(GDPi / GDPglobal). Small economies are by definition more exposed to foreign trade, regardless of their trade policy or competitiveness.
Figure 8: Openness of the US economy decreases

Figure 9: Openness Netherlands

In the longer term, the efficiency of firms could deteriorate as well. At the current juncture, it is still too early to judge whether the global economy is also facing another wave of zombie firms in the post-corona crisis era (see for more information Appendix A). We already take part of this risk into account by factoring in a lower level of entrepreneurship activity in our calculations. However, there is a real risk that zombification will emerge as an even bigger problem in the aftermath of the corona crisis for a number of reasons. For one, interest rates are expected to continue to stay at record lows due to unorthodox monetary policy measures. The Bank of England has temporarily introduced monetary finance of government expenditure, the Fed cut policy rates all the way to zero and both the Fed and ECB have launched massive QE programmes. Moreover, policy makers in emerging markets are also aggressively cutting rates and are even openly discussing QE programs and debt monetization as well. Secondly, short-time work (STW) schemes have broadly been rolled out with minimal criteria for firms to participate.
The key question going forward, therefore, is whether it will be politically possible for governments to introduce more stringent criteria and timely phase out the STW schemes. Finally, the corona crisis has exposed the vulnerability of globally integrated supply chains and might accelerate the deglobalization trend, with potential adverse effects on productivity. Moreover, post-COVID-19, the global geopolitical situation is likely to be even more challenging than before.
The impact on the US and the Netherlands?
When we apply the assumptions highlighted above to our US and Netherlands productivity and labor market models (here and here), we end up with a much gloomier picture for the short term than in our baseline (see Figures 10 and 12). Without a profound recovery in 2021, the average annual growth rate of GDP per capita in the US could fall to as low as 0.9% (compared to the expected rate of 1.1% in a no-corona scenario). In an extended lockdown scenario, this rate could even drop to 0.6% per annum (Figure 11). For the Netherlands, in the absence of a V-shaped recovery, we expect GDP per capita to level off to 0.9% (from 1.1% in a no-corona scenario) and to 0.7% in an extended lockdown scenario.
For the US, these assumptions imply that the average annual economic growth potential (between 2022-2030) could drop from 1.6% to 1.4% and 1.2% in an extended lockdown scenario. In the Netherlands, potential growth in the years beyond 2021 is expected to drop from 1.3% to 1.1% due to the long-term impact of the corona crisis. An extended lockdown would shave off another 0.2ppts annually.
Figure 10: A V-shape recovery?

Figure 11: Trajectories without V-shape recovery

Figure 12: Dutch economy set for a V-shaped rebound?

Figure 13: …or will we get something like this?

The economic price of the corona crisis
Of course, the US and Dutch economies are very different in many respects. But the results of our exercise show similar patterns (see Table 1), suggesting that they could also give an idea of the potential impact of COVID-19 for other countries. Compared to the V-shaped recovery scenario we currently have penciled in, welfare losses in the short term would roughly double in case of a U/L-shape.
In our baseline scenario (where we assume lockdowns between 3 and 8 weeks, depending on the country concerned[4]), GDP losses would end up being USD 2,200 for each American, but USD 4,200 in case of a less profound rebound. In an extended lockdown scenario (extension by three months), the price tag of the corona crisis could end up being somewhere between USD 5,500 and USD 13,000 per capita in the long run.
In the Netherlands, the economic losses of the corona crisis for each citizen in the short term could end up being somewhere between roughly EUR 1,300 and EUR 2,600, depending on the shape of the recovery. In the long run, an additional EUR 1,000 of missed growth would be the result of lower potential growth beyond 2021. In an extended lockdown scenario, the long-term losses would end up between roughly EUR 4,500 and EUR 9,000 per capita.
[4] Seen from the starting point of our growth projection in early April.
Table 1: Impact of corona crisis on GDP per capita (differences compared to a no-corona scenario)

Appendix A: Theory in more detail
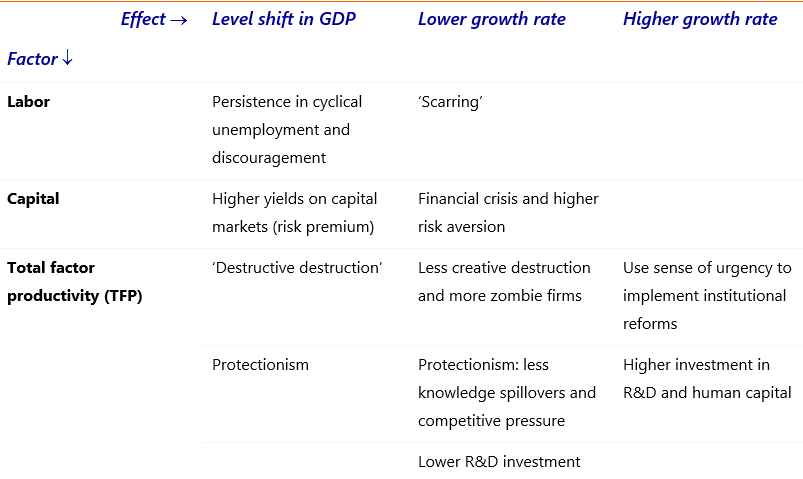
We have summed up the various mechanisms that affect the growth trajectories of countries facing an economic crisis in the table below. The level shift in GDP is especially caused by shocks on the labor market and lower investment. The most important factor determining the growth rate is TFP growth. In the following section we will describe some of these factors more in detail.
Table 2: The impact of a crisis on the economic growth trajectory
Labor market impact
In the current crisis, employment is falling due to a mixture of supply and demand effects,firms are being forced to lay off workers and unemployment is rising substantially, especially in the flexible US labor market. As employment usually does not pick up in tandem with the economic recovery, part of the unemployed labor force will be unable to find a job immediately. The CPB Netherlands Bureau for Economic Policy Analysis concludes that employment growth usually lags behind GDP growth by approximately half a year, since firms do not immediately open new vacancies if demand increases.
Eventually, downward pressure on wages will make sure that the labor market eventually clears, but in case of rigid labor markets this process can take a while (so-called persistence) and the risk of a ‘jobless recovery’ increases (see Shimer, 2012). Therefore, labor market institutions play a central role in determining the speed of recovery on the labor market.
In addition, some workers who fail to find a job will become discouraged and withdraw entirely from the labor market. This discouraged worker effect implies that the job search costs of discouraged workers outweigh their expected benefits. A study by the OECD (2011) shows that persistence also applies to lower participation rates after a severe crisis. A severe to very severe downturn has a negative persistent impact on labor participation rates that can persist for over a decade (see Figure 3).
Many empirical studies reject the hypothesis that cyclical unemployment can have an effect on structural unemployment (so-called hysteresis), at least in a quantitative sense (see this overview). From this perspective, labor market dynamics during a crisis result in a one-off in terms of GDP losses, hence a drop in GDP levels (see Figure 2). However, there are studies that have looked into so-called scarring effects, which means that the quality of the labor force deteriorates due to persistent unemployment and the share of people that become ‘trapped’ in less-paid job increases. There are indeed studies (e.g. here and here) that find that (early) unemployment spells result in a ‘wage penalty’ of 13% to 15% (compared to a situation without unemployment).
Investment and capital
During an economic crisis, investments are hurt in the short term due to uncertainty and a higher risk premium on investment. Lower investment, and consequently lower capital accumulation, during the crisis result in a lower capital stock after the crisis, which leads to a shift in GDP (per capita) levels (see again Figure 2). During economic crisis, capital destruction can take place as well, which can take the form of, for example, a capital depreciation shock or asset quality shock. Capital destruction does not mean that capital goods are actually destroyed (although this can happen in case of a surge in bankruptcies). Rather it reflects that investments made prior to a crisis turn out to be worth much less than originally thought, and the crisis results in the contraction of some industries whose capital is not suited to changes in the economic environment (see Riggi, 2012). In short, capital destruction means that an economic crisis renders part of the capital stock economically obsolete. Investment may also shift toward other sectors, again making the existing capital stock less valuable.
Investments in the long term could be hurt as well, because risk aversion might permanently rise for young people living through this crisis. Previous research indeed shows that young people that have been through severe crises or a traumatic experience tend to be more risk averse later in life. One could argue that the current situation reflects both.
Financial crises and the policy response
Shocks to capital and investment are amplified in case of financial crises (see Serra and Saxena, 2008). During a normal economic downturn, financial institutions face strains in their ability to attracts funds from depositors, which widens the gap between loan and deposit rates and raises the borrowing costs for non-financial institutions. In case of a financial crisis (for instance rapidly deteriorating bank balance sheets), financial institutions not only face problems in attracting depositor funds, but also in obtaining funds in the interbank market. This is because financial turbulence leads to a rationing of debt and equity provisions by banks. If this leads to a credit crunch, this severely deepens the economic slowdown as well as attenuating the recovery path thereafter. There are multiple studies showing that a reduction in credit availability due to a change in financial conditions has significant adverse consequences for macroeconomic outcomes (see Gilchrist and Zakrajšek, 2012; Hall, 2011).
It is also worth bearing in mind that the policy response is extremely important. The case of Japan and Sweden in the 1990s (see Appendix A) shows that it is of the utmost importance for policymakers to prevent the current health crisis from spiraling into a financial crisis. If such an unfortunate scenario were to unfold, history shows that a swift response to clean up the financial sector in combination with a structural reform package is the preferred strategy.
Productivity
The most important driver of the economic growth rate after a severe crisis is productivity growth, more specifically total factor productivity (TFP). TFP is an indicator of technology in the broadest sense of the word, as it indicates how productive both capital and labor are in generating value added.
In case of a financial crisis or political crisis, the likelihood of a substantial lower growth rate is much higher. Cerra and Saxena (2008) show that, even in its mildest form, a financial crisis in advanced economies leads to an output loss that would be at least 1% after 10 years.
Zombification
In the aftermath of COVID-19, the trend of zombification in some countries could be aggravated. The BIS (2018) defines zombie firms as those that:
- are old, over 10 years;
- are unprofitable, e.g. experiencing problems in servicing debt;
- have a low expected future profitability.
The BIS study also shows that the amount of zombies in the G10 rose from 5% in 2000 to 12% in 2017. A higher share of zombie firms is detrimental to productivity growth. First, according to the OECD (2017), a higher share of industry capital allocated toward zombie firms crowds out growth (in term of investment and employment) of typical non-zombie firms. Moreover, zombie firms also create barriers to entry, as the productivity gap between zombie and non-zombie firms widens. New entrants must clear this productivity threshold to compensate for lower market profitability, as zombie congestion inflates wages relative to productivity and depresses market prices and (non-zombie) market shares (see OECD, 2017).
A higher share of sunk industry capital in zombie firms tends to crowd-out the growth – measured in terms of investment and employment – of the typical non-zombie firm. Moreover, after market entry, zombie congestion also weighs on employment growth in young non-zombie firms. The BIS has estimated that a 1% rise in the share of zombie firms in a country reduces productivity growth by 0.3ppts. So even a seemingly modest 2ppts rise in the share of zombies, could shave off 0.6ppts of economic growth, which represents about a third of the average growth rate of developed economies.
One important cause of the rise in zombies is the existence of weak banks, something we clearly witnessed in Japan in the 1990s (Caballero et al., 2008). Weak banks facing stressed balance sheets have an incentive to rollover debt to zombie firms in order to prevent a write off of these loans. Moreover, the BIS mentions the low interest rate environment as one of the key variables in explaining the rise of the zombies. Low rates can reduce pressure on creditors to clean up their balance sheets, as low interest rates reduce the return on alternative assets and thereby the opportunity costs of the balance sheet clean-up. Moreover, low interest rates weigh on the costs of funding and of bad loans and increase the expected recovery rate.
A study by Aghion et al. (2019) indeed shows that there is an inverted U-shape between credit access and productivity growth. First, credit fosters funding of innovation, but after a certain optimum, negative reallocation effects occur, as too much credit hampers the exit rate of incumbent unsuccessful firms, blocking the entry of potentially more efficient innovators. Easy access to credit has become easier in the global environment of low interest rates and massive quantitative easing packages launched in the US, Japan and Eurozone.
Figure 14: Capital stuck in zombie firms is a problem in Greece, Italy and Spain

Figure 15: The share of listed zombie firms has doubled in the US

Within Europe, zombification seems to be especially a problem in Greece, Italy and Spain (Figure 14). For Italy, this is driven by an overly lenient banking sector. But the problem also seems to be big and growing in countries where the banking sector is not overly lenient, such as the US (Figure 15). Here low interest rates may be a more important factor in explaining the rise of zombie firms. Finally, zombification could also be a problem in countries with a large share of public firms (State Owned Enterprises) as, for example, in China. Although we do not have data on the number of zombie firms in China, based on our earlier analysis on Chinese SOE profitability, this problem is likely to be sizable.
Short-term work schemes
One of the measures several European countries have introduced to fight a sharp rise in unemployment are so-called short-time work (STW) schemes. Many of these schemes are modeled after the German Kurzarbeit scheme, which has been used since the 1980s to fight spikes in unemployment during crises. This mainly European approach stands in sharp contrast to the US approach where claims for unemployment benefits are rising rapidly.
The essence of STW schemes is that companies can sharply reduce the hours worked by an employee and cut wage costs. The government, however, partially makes up for the lost income of workers. This allows companies to retain workers who are, temporarily, unproductive (so-called labor hoarding). This should prevent unemployment from rising.
This STW scheme worked well for Germany during the GFC, and as a consequence has been copied by a number of countries such as the Netherlands, Italy, Spain and the UK. Its use is not without side effects however. Short-time work schemes can lead to inefficiencies in the labor market, as some people are kept in positions that would otherwise have been lost. In this sense, the schemes can hinder a reallocation of labor to more productive jobs. Finally, some countries tend to keep short-time working schemes in place even after a crisis is over, like Italy and Belgium did after the GFC.
So even though the use of short-time work schemes could go a long way in preventing unemployment from spiking (and thus limit the adverse demand shock) in Europe, these schemes could also increase inefficiencies in the economy and, as a consequence, reduce productivity down the line. This does not mean that we would advise against these STW schemes as a policy option, but we would like to stress than an exit strategy after the crisis is of vital importance to prevent long-term disruptions to the labor market and to prevent a rise of subsidy-dependent zombie firms. In contrast, the US approach allows for a larger adverse demand effect.
Losses to human capital, R&D and entrepreneurship
Closed schools will inevitably affect the education of young people to some extent, despite home-schooling. This is in effect a deterioration of future human capital accumulation. It seems that even a relatively small amount of missed education could potentially have large effects on people’s future human capital. Studies have shown that losing even ten days of education (Carlson et al. 2005) or one hour per week (Lavy, 2015) results in significantly lower test scores of students.
Domestic investment in innovation will also likely be scaled down by firms, as operating costs are expected to rise substantially, forcing firms to critically re-assess budgets for R&D. Finally, entrepreneurship could suffer, not only in the short term, but potentially in the very long term as well. Given that risk aversion plays a role in entrepreneurship, our previously mentioned long-term effects of crises on risk-taking behavior could reduce entrepreneurship. Less entrepreneurship will lead to less creative destruction, the process by which (loosely speaking) the pool of firms in a given country is constantly replaced by ones that are more efficient and innovative or in another way are better at catering to peoples’ (changing) wants and needs. Note that another (potentially more important) reason that creative destruction could be hindered is barriers to entry and exit being raised by a higher share of zombie firms, which we discussed earlier.
De-globalization, protectionism
The corona crisis has exposed the vulnerability of globally integrated supply chains and might initiate a de-globalization trend with firms reshoring part of their production activities to the home base. Note that rethinking global supply chains had already started in light of the increasing tensions between the US and China prior to COVID-19. Moreover, after the shortages experienced during COVID-19 we might see firms ramping up on stocks at the expense of efficiency. Although these shifts will bolster resilience of production, they also have an adverse impact on productivity.
Trade, foreign direct investment and human capital mobility are important channels to transfer knowledge across the globe (see Erken, Donselaar and Thurik, 2016). These international spillovers are especially important for countries to foster catching up with technologically more advanced countries.
For technologically more advanced countries, however, there are important productivity effects from trade openness. Lower openness to foreign trade will reduce market competition, which is necessary to stimulate firms to operate lean and mean, and increase efforts to innovate. In this sense, lower import competition will result in less innovative, less efficient firms (the within firm effect). Secondly, there are sector composition effects (the between firm effect): higher trade costs will result in less efficient allocation of labor and capital toward more productive and skill-intensive firms within sectors, and toward skill-intensive sectors in all countries. Indeed, there is evidence that within- and between-industry reallocations during periods of trade liberalization raised average productivity in all industries, but more so in the comparative advantage industries.
Taken together, a study for Europe shows that both between- and within- firm effects account for 14% of European technology upgrading in the period 2000-2007. Other studies (here and here) find a robust direct positive effect of international trade on productivity. As trade has a beneficial impact on labor productivity, a pullback in trade caused by higher trade costs caused by the COVID-19 crisis and subsequent structural de-globalization trend will likely have an adverse impact on productivity development going forward.
Appendix B – Different policy responses after a crisis may lead to very different outcomes – The case of Sweden and Japan
Both Sweden and Japan faced financial crisis at the beginning of the 1990s. Both countries moved in completely opposite directions in the aftermath of the direct shock, and the way they dealt with that crisis led to entirely different outcomes. This highlights both the role and importance of the policy response.
Figure 16: Growth in Sweden took off after the 1990 crisis…

Figure 17: …whereas growth rates in Japan dropped by a factor 3

Sweden
In Sweden, the financial crisis had its roots in over-investment in the real estate market, which was amplified by strong deregulation of credit markets in the period 1983-1985 (see Englund, 1999). A real interest rate shock[5] triggered a downward spiral in assets prices, resulting in a surge in bankruptcies and credit losses. The Swedish economy tumbled into a severe recession, registering three subsequent years of economic contraction with private investment plummeting by 35% and unemployment surging. The Swedish government took a number of important policy steps in order to fight the financial crisis. First and foremost, the government initiated swift action to clean up the financial sector. It obliged full disclosure by banks, communicated broad guarantees of deposits and forced owners of the banks to take a haircut. Moreover, the bank resolution policy was based on open-ended funding and authorities adopted a strategy to divide banks into three different categories, depending on the capital adequacy ratio and the viability of banks going forward. Assets of banks were split into good and bad assets. The bad assets were placed under supervision of two asset management corporations as part of the resolution process.
Besides initiating swift action to clean up the financial sector, the Swedish government seized the sense of urgency of the financial crisis to initiate institutional reforms and initiate policies to make its industries more competitive, innovative and dynamic. The transport, telecommunication and energy markets were liberalized and private enterprises were allowed to provide public education services. Moreover, the pension scheme was partly privatized and on the labor market it became easier to hire people on a fixed-term contract basis. Ultimately, the abolishment of the pegged krona in 1992 marked the beginning of the recovery for the Swedish economy. The move from a pegged exchange rate regime to inflation targeting also resulted in favorable labor market effects, as the low inflation regime led to non-indexed two-year wage agreements (see here).
Japan
Similar to Sweden, the Japanese asset bubble in the 80s was most likely related to financial deregulation in the 80s (see BIS, 2001). After the bubble burst, equity prices slid by 60% over three years and commercial land prices roughly lost half of their value over the subsequent decade. In contrast to Sweden’s fierce policy response to clean up the financial system, the political and regulatory response in Japan was to deny the eroding collateral in the banking system and delay reforms and restructuring of banks (Caballero et al., 2008). Regulators did not adopt a resolution policy and only requested banks to be compliant to Basel capital requirements. The result was that Japanese banks were afraid to fall below the required capital standard and began rolling over loans to insolvent firms, the zombie firms that we discussed extensively earlier in this report. Despite the fact that the Bank of Japan aggressively cut rates and the government launched a large-scale fiscal package (running annual budget deficits of 6%), these policy measures hardly had any impact in reviving the economy. Hoshi and Kashyap (2003) argue in this respect that: “The low interest rates have partially helped keep the banks alive, and the deficit spending has partially propped up aggregate demand, but neither of these policies has focused on closing down the insolvent banks and their zombie borrowers that are strangling the economy.”
[5] Interest rates rose due to both domestic and international factors. International interest rates increased because of tightening monetary policy by the Bundesbank as a response to German reunification. As the Swedish krona was pegged to the ECU – interest rates in Sweden also rose. Domestically, Sweden introduced a tax reform in 1990-1991 which significantly reduced the tax deductibility of mortgage rates, significantly raising real after-tax interest rates.